

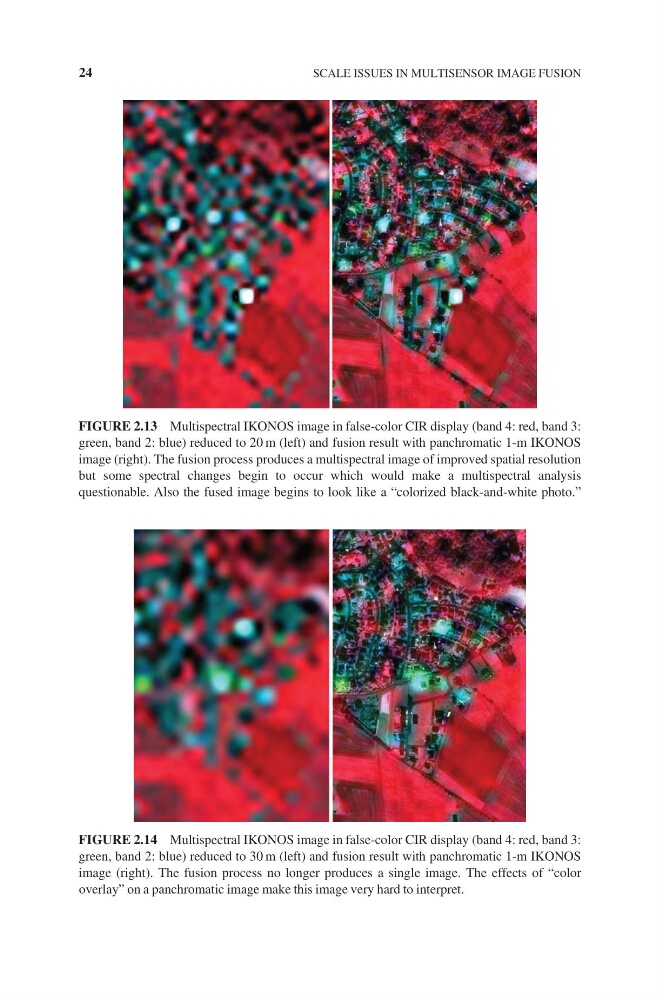
FIGURE 2.13 Multispectral IKONOS image in false-color CIR display (band 4: red, band 3:
green, band 2: blue) reduced to 20 m (left) and fusion result with panchromatic 1-m IKONOS
image (right). The fusion process produces a multispectral image of improved spatial resolution
but some spectral changes begin to occur which would make a multispectral analysis
questionable. Also the fused image begins to look like a “colorized black-and-white photo.”
FIGURE 2.14 Multispectral IKONOS image in false-color CIR display (band 4: red, band 3:
green, band 2: blue) reduced to 30 m (left) and fusion result with panchromatic 1-m IKONOS
image (right). The fusion process no longer produces a single image. The effects of “color
overlay” on a panchromatic image make this image very hard to interpret.
24
SCALE ISSUES IN MULTISENSOR IMAGE FUSION
green, band 2: blue) reduced to 20 m (left) and fusion result with panchromatic 1-m IKONOS
image (right). The fusion process produces a multispectral image of improved spatial resolution
but some spectral changes begin to occur which would make a multispectral analysis
questionable. Also the fused image begins to look like a “colorized black-and-white photo.”
FIGURE 2.14 Multispectral IKONOS image in false-color CIR display (band 4: red, band 3:
green, band 2: blue) reduced to 30 m (left) and fusion result with panchromatic 1-m IKONOS
image (right). The fusion process no longer produces a single image. The effects of “color
overlay” on a panchromatic image make this image very hard to interpret.
24
SCALE ISSUES IN MULTISENSOR IMAGE FUSION