

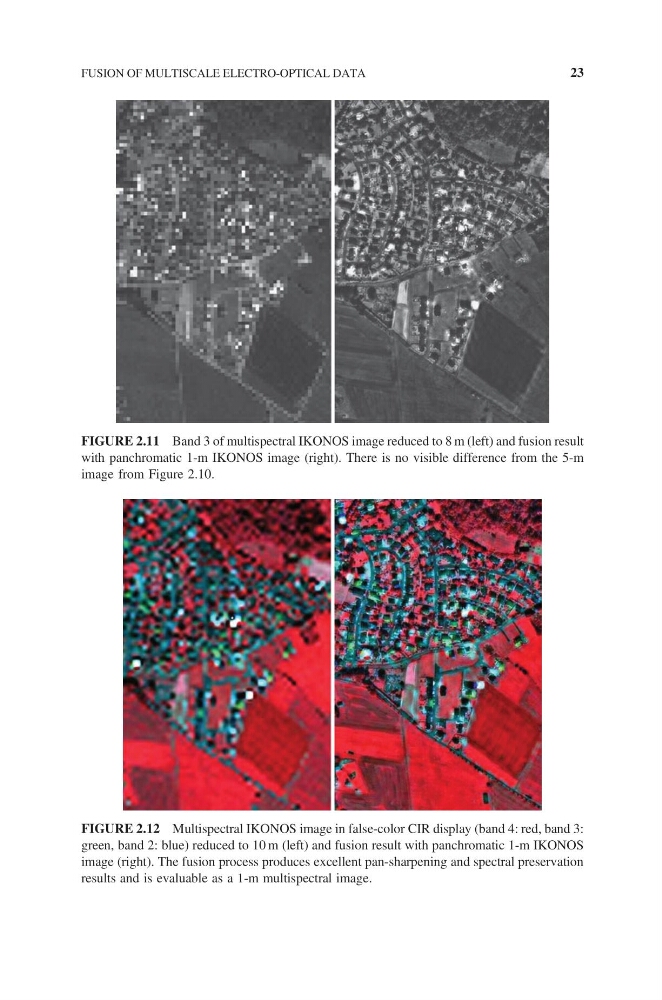
FIGURE 2.11 Band 3 of multispectral IKONOS image reduced to 8 m (left) and fusion result
with panchromatic 1-m IKONOS image (right). There is no visible difference from the 5-m
image from Figure 2.10.
FIGURE 2.12 Multispectral IKONOS image in false-color CIR display (band 4: red, band 3:
green, band 2: blue) reduced to 10 m (left) and fusion result with panchromatic 1-m IKONOS
image (right). The fusion process produces excellent pan-sharpening and spectral preservation
results and is evaluable as a 1-m multispectral image.
FUSION OF MULTISCALE ELECTRO-OPTICAL DATA
23
with panchromatic 1-m IKONOS image (right). There is no visible difference from the 5-m
image from Figure 2.10.
FIGURE 2.12 Multispectral IKONOS image in false-color CIR display (band 4: red, band 3:
green, band 2: blue) reduced to 10 m (left) and fusion result with panchromatic 1-m IKONOS
image (right). The fusion process produces excellent pan-sharpening and spectral preservation
results and is evaluable as a 1-m multispectral image.
FUSION OF MULTISCALE ELECTRO-OPTICAL DATA
23