

resampling method appear on the fields. The fused images seem to be blurred. For
the assessment of spectral characteristic preservation one has also to consider that
one pixel in a 20-m multispectral image represents 400 pixels in the 1-m
panchromatic image. There is an enormous information gap which makes the
images look like an IKONOS image with “some color overlay.” Based on this
analysis with real multisensor data, the cutoff scale ratio for image fusion seems to
lie near 1 : 10.
2.4.3 Image Fusion with Variable Spatial Resolution
For a thorough analysis of the scale effects for EO image fusion, we used only the
single-sensor IKONOS data set, thus alleviating all multisensor and multitemporal
influences in the fusion process. In this investigation the IKONOS multispectral
image was reduced to different spatial resolutions, which represent common satellite
sensors used in remote sensing. These resolutions are 5, 8, 10, 20, 30, and 32 m.
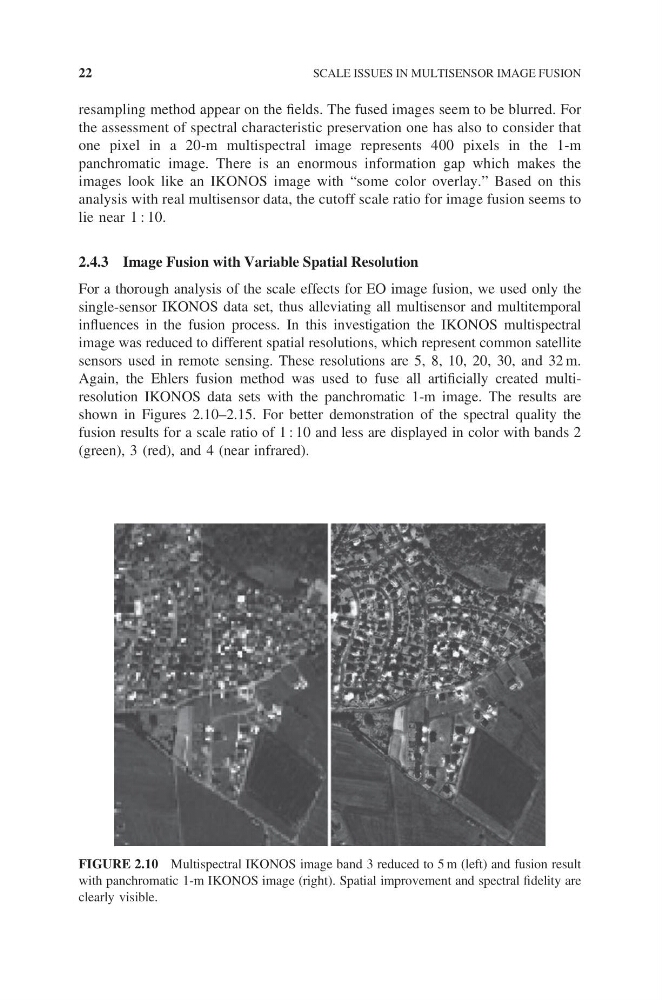
Again, the Ehlers fusion method was used to fuse all artificially created multiresolution IKONOS data sets with the panchromatic 1-m image. The results are
shown in Figures 2.10–2.15. For better demonstration of the spectral quality the
fusion results for a scale ratio of 1 : 10 and less are displayed in color with bands 2
(green), 3 (red), and 4 (near infrared).
FIGURE 2.10 Multispectral IKONOS image band 3 reduced to 5 m (left) and fusion result
with panchromatic 1-m IKONOS image (right). Spatial improvement and spectral fidelity are
clearly visible.
22
SCALE ISSUES IN MULTISENSOR IMAGE FUSION
the assessment of spectral characteristic preservation one has also to consider that
one pixel in a 20-m multispectral image represents 400 pixels in the 1-m
panchromatic image. There is an enormous information gap which makes the
images look like an IKONOS image with “some color overlay.” Based on this
analysis with real multisensor data, the cutoff scale ratio for image fusion seems to
lie near 1 : 10.
2.4.3 Image Fusion with Variable Spatial Resolution
For a thorough analysis of the scale effects for EO image fusion, we used only the
single-sensor IKONOS data set, thus alleviating all multisensor and multitemporal
influences in the fusion process. In this investigation the IKONOS multispectral
image was reduced to different spatial resolutions, which represent common satellite
sensors used in remote sensing. These resolutions are 5, 8, 10, 20, 30, and 32 m.
Again, the Ehlers fusion method was used to fuse all artificially created multiresolution IKONOS data sets with the panchromatic 1-m image. The results are
shown in Figures 2.10–2.15. For better demonstration of the spectral quality the
fusion results for a scale ratio of 1 : 10 and less are displayed in color with bands 2
(green), 3 (red), and 4 (near infrared).
FIGURE 2.10 Multispectral IKONOS image band 3 reduced to 5 m (left) and fusion result
with panchromatic 1-m IKONOS image (right). Spatial improvement and spectral fidelity are
clearly visible.
22
SCALE ISSUES IN MULTISENSOR IMAGE FUSION