

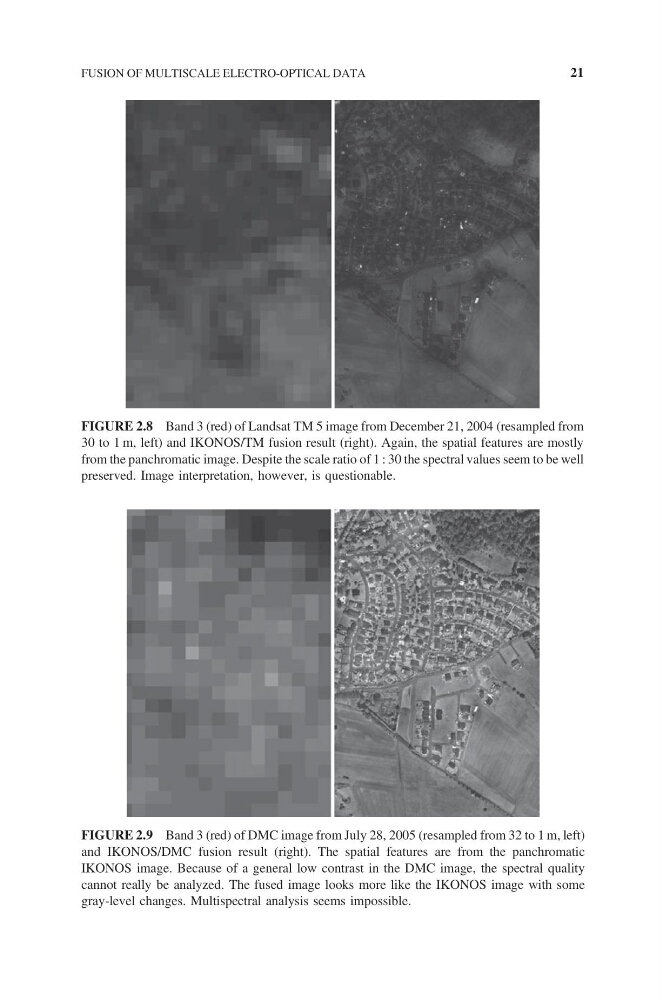
FIGURE 2.8 Band 3 (red) of Landsat TM 5 image from December 21, 2004 (resampled from
30 to 1 m, left) and IKONOS/TM fusion result (right). Again, the spatial features are mostly
from the panchromatic image. Despite the scale ratio of 1 : 30 the spectral values seem to be well
preserved. Image interpretation, however, is questionable.
FIGURE 2.9 Band 3 (red) of DMC image from July 28, 2005 (resampled from 32 to 1 m, left)
and IKONOS/DMC fusion result (right). The spatial features are from the panchromatic
IKONOS image. Because of a general low contrast in the DMC image, the spectral quality
cannot really be analyzed. The fused image looks more like the IKONOS image with some
gray-level changes. Multispectral analysis seems impossible.
FUSION OF MULTISCALE ELECTRO-OPTICAL DATA
21
30 to 1 m, left) and IKONOS/TM fusion result (right). Again, the spatial features are mostly
from the panchromatic image. Despite the scale ratio of 1 : 30 the spectral values seem to be well
preserved. Image interpretation, however, is questionable.
FIGURE 2.9 Band 3 (red) of DMC image from July 28, 2005 (resampled from 32 to 1 m, left)
and IKONOS/DMC fusion result (right). The spatial features are from the panchromatic
IKONOS image. Because of a general low contrast in the DMC image, the spectral quality
cannot really be analyzed. The fused image looks more like the IKONOS image with some
gray-level changes. Multispectral analysis seems impossible.
FUSION OF MULTISCALE ELECTRO-OPTICAL DATA
21