

14.5 FILTERING TESTS
Both the previously developed multiscale erosion and the new local shifting method
were applied to the ISPRS data sets for two sites (www.commission3.isprs.org/
wg3/). The first site corresponds to an urban area (CSite2) exhibiting large and
irregular shaped buildings as well as a road with a bridge and small tunnel. The
second site corresponds to a rural area (FSite5) with vegetation on steep slopes,
quarry, vegetation on river banks, and gaps. The original point cloud included
elevation and intensity from the first and last returns; however, only the first return
was used in the tests as it was generally the cleanest measurement due to multiple
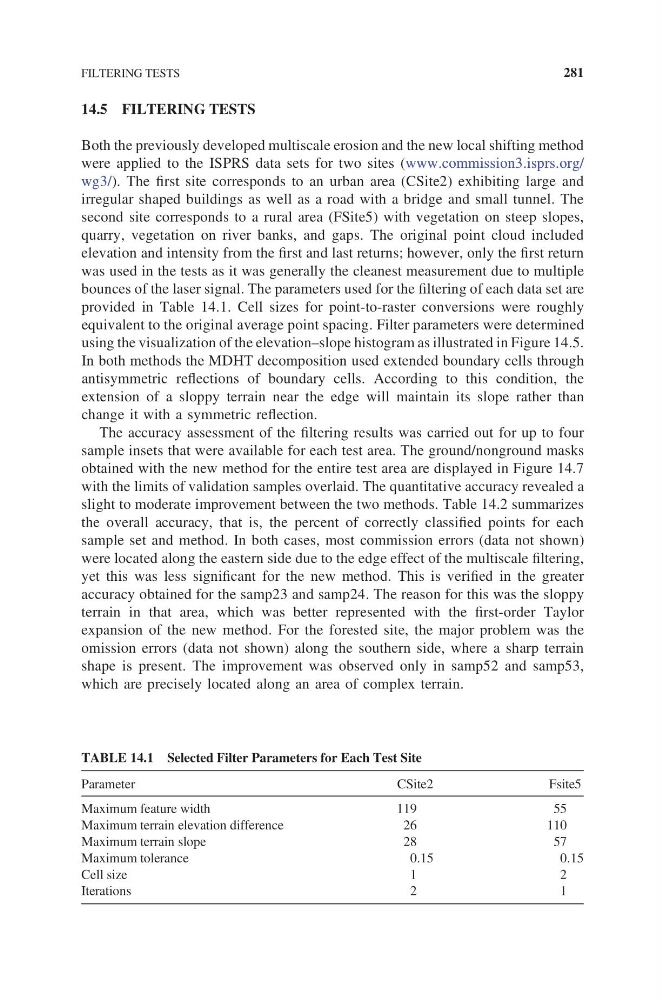
bounces of the laser signal. The parameters used for the filtering of each data set are
provided in Table 14.1. Cell sizes for point-to-raster conversions were roughly
equivalent to the original average point spacing. Filter parameters were determined
using the visualization of the elevation–slope histogram as illustrated in Figure 14.5.
In both methods the MDHT decomposition used extended boundary cells through
antisymmetric reflections of boundary cells. According to this condition, the
extension of a sloppy terrain near the edge will maintain its slope rather than
change it with a symmetric reflection.
The accuracy assessment of the filtering results was carried out for up to four
sample insets that were available for each test area. The ground/nonground masks
obtained with the new method for the entire test area are displayed in Figure 14.7
with the limits of validation samples overlaid. The quantitative accuracy revealed a
slight to moderate improvement between the two methods. Table 14.2 summarizes
the overall accuracy, that is, the percent of correctly classified points for each
sample set and method. In both cases, most commission errors (data not shown)
were located along the eastern side due to the edge effect of the multiscale filtering,
yet this was less significant for the new method. This is verified in the greater
accuracy obtained for the samp23 and samp24. The reason for this was the sloppy
terrain in that area, which was better represented with the first-order Taylor
expansion of the new method. For the forested site, the major problem was the
omission errors (data not shown) along the southern side, where a sharp terrain
shape is present. The improvement was observed only in samp52 and samp53,
which are precisely located along an area of complex terrain.
TABLE 14.1 Selected Filter Parameters for Each Test Site
Parameter
CSite2
Fsite5
Maximum feature width
119
55
Maximum terrain elevation difference
26
110
Maximum terrain slope
28
57
Maximum tolerance
0.15
0.15
Cell size
1
2
Iterations
2
1
FILTERING TESTS
281
Both the previously developed multiscale erosion and the new local shifting method
were applied to the ISPRS data sets for two sites (www.commission3.isprs.org/
wg3/). The first site corresponds to an urban area (CSite2) exhibiting large and
irregular shaped buildings as well as a road with a bridge and small tunnel. The
second site corresponds to a rural area (FSite5) with vegetation on steep slopes,
quarry, vegetation on river banks, and gaps. The original point cloud included
elevation and intensity from the first and last returns; however, only the first return
was used in the tests as it was generally the cleanest measurement due to multiple
bounces of the laser signal. The parameters used for the filtering of each data set are
provided in Table 14.1. Cell sizes for point-to-raster conversions were roughly
equivalent to the original average point spacing. Filter parameters were determined
using the visualization of the elevation–slope histogram as illustrated in Figure 14.5.
In both methods the MDHT decomposition used extended boundary cells through
antisymmetric reflections of boundary cells. According to this condition, the
extension of a sloppy terrain near the edge will maintain its slope rather than
change it with a symmetric reflection.
The accuracy assessment of the filtering results was carried out for up to four
sample insets that were available for each test area. The ground/nonground masks
obtained with the new method for the entire test area are displayed in Figure 14.7
with the limits of validation samples overlaid. The quantitative accuracy revealed a
slight to moderate improvement between the two methods. Table 14.2 summarizes
the overall accuracy, that is, the percent of correctly classified points for each
sample set and method. In both cases, most commission errors (data not shown)
were located along the eastern side due to the edge effect of the multiscale filtering,
yet this was less significant for the new method. This is verified in the greater
accuracy obtained for the samp23 and samp24. The reason for this was the sloppy
terrain in that area, which was better represented with the first-order Taylor
expansion of the new method. For the forested site, the major problem was the
omission errors (data not shown) along the southern side, where a sharp terrain
shape is present. The improvement was observed only in samp52 and samp53,
which are precisely located along an area of complex terrain.
TABLE 14.1 Selected Filter Parameters for Each Test Site
Parameter
CSite2
Fsite5
Maximum feature width
119
55
Maximum terrain elevation difference
26
110
Maximum terrain slope
28
57
Maximum tolerance
0.15
0.15
Cell size
1
2
Iterations
2
1
FILTERING TESTS
281