

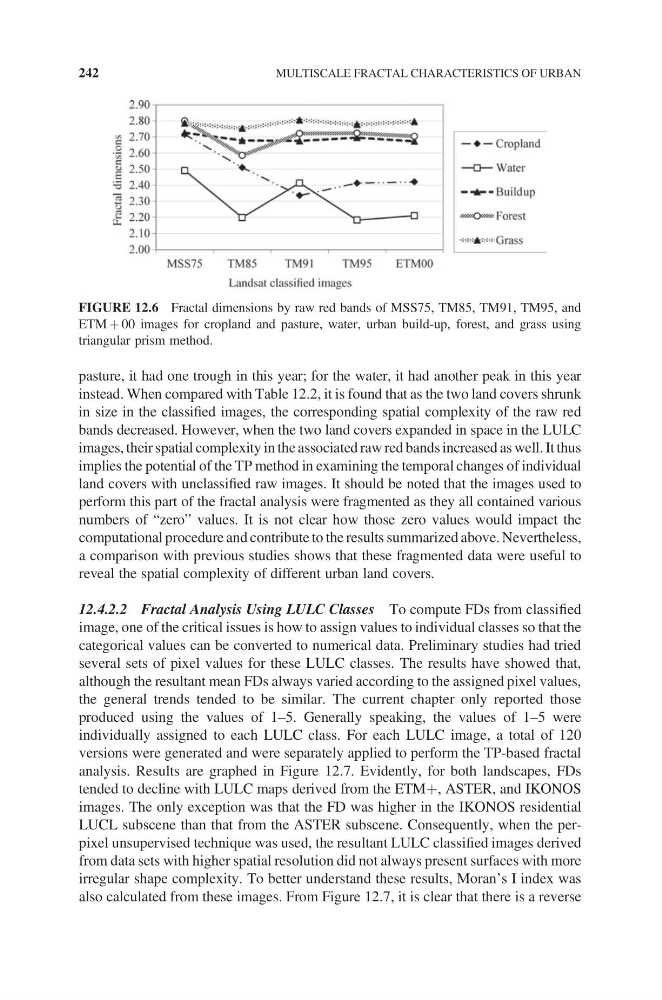
pasture, it had one trough in this year; for the water, it had another peak in this year
instead. When compared with Table 12.2, it is found that as the two land covers shrunk
in size in the classified images, the corresponding spatial complexity of the raw red
bands decreased. However, when the two land covers expanded in space in the LULC
images, their spatial complexity in the associated raw red bands increased as well. It thus
implies the potential of the TP method in examining the temporal changes of individual
land covers with unclassified raw images. It should be noted that the images used to
perform this part of the fractal analysis were fragmented as they all contained various
numbers of “zero” values. It is not clear how those zero values would impact the
computational procedure and contribute to the results summarized above. Nevertheless,
a comparison with previous studies shows that these fragmented data were useful to
reveal the spatial complexity of different urban land covers.
12.4.2.2 Fractal Analysis Using LULC Classes To compute FDs from classified
image, one of the critical issues is how to assign values to individual classes so that the
categorical values can be converted to numerical data. Preliminary studies had tried
several sets of pixel values for these LULC classes. The results have showed that,
although the resultant mean FDs always varied according to the assigned pixel values,
the general trends tended to be similar. The current chapter only reported those
produced using the values of 1–5. Generally speaking, the values of 1–5 were
individually assigned to each LULC class. For each LULC image, a total of 120
versions were generated and were separately applied to perform the TP-based fractal
analysis. Results are graphed in Figure 12.7. Evidently, for both landscapes, FDs
tended to decline with LULC maps derived from the ETM+, ASTER, and IKONOS
images. The only exception was that the FD was higher in the IKONOS residential
LUCL subscene than that from the ASTER subscene. Consequently, when the perpixel unsupervised technique was used, the resultant LULC classified images derived
from data sets with higher spatial resolution did not always present surfaces with more
irregular shape complexity. To better understand these results, Moran’s I index was
also calculated from these images. From Figure 12.7, it is clear that there is a reverse
FIGURE 12.6 Fractal dimensions by raw red bands of MSS75, TM85, TM91, TM95, and
ETM + 00 images for cropland and pasture, water, urban build-up, forest, and grass using
triangular prism method.
242
MULTISCALE FRACTAL CHARACTERISTICS OF URBAN
instead. When compared with Table 12.2, it is found that as the two land covers shrunk
in size in the classified images, the corresponding spatial complexity of the raw red
bands decreased. However, when the two land covers expanded in space in the LULC
images, their spatial complexity in the associated raw red bands increased as well. It thus
implies the potential of the TP method in examining the temporal changes of individual
land covers with unclassified raw images. It should be noted that the images used to
perform this part of the fractal analysis were fragmented as they all contained various
numbers of “zero” values. It is not clear how those zero values would impact the
computational procedure and contribute to the results summarized above. Nevertheless,
a comparison with previous studies shows that these fragmented data were useful to
reveal the spatial complexity of different urban land covers.
12.4.2.2 Fractal Analysis Using LULC Classes To compute FDs from classified
image, one of the critical issues is how to assign values to individual classes so that the
categorical values can be converted to numerical data. Preliminary studies had tried
several sets of pixel values for these LULC classes. The results have showed that,
although the resultant mean FDs always varied according to the assigned pixel values,
the general trends tended to be similar. The current chapter only reported those
produced using the values of 1–5. Generally speaking, the values of 1–5 were
individually assigned to each LULC class. For each LULC image, a total of 120
versions were generated and were separately applied to perform the TP-based fractal
analysis. Results are graphed in Figure 12.7. Evidently, for both landscapes, FDs
tended to decline with LULC maps derived from the ETM+, ASTER, and IKONOS
images. The only exception was that the FD was higher in the IKONOS residential
LUCL subscene than that from the ASTER subscene. Consequently, when the perpixel unsupervised technique was used, the resultant LULC classified images derived
from data sets with higher spatial resolution did not always present surfaces with more
irregular shape complexity. To better understand these results, Moran’s I index was
also calculated from these images. From Figure 12.7, it is clear that there is a reverse
FIGURE 12.6 Fractal dimensions by raw red bands of MSS75, TM85, TM91, TM95, and
ETM + 00 images for cropland and pasture, water, urban build-up, forest, and grass using
triangular prism method.
242
MULTISCALE FRACTAL CHARACTERISTICS OF URBAN