

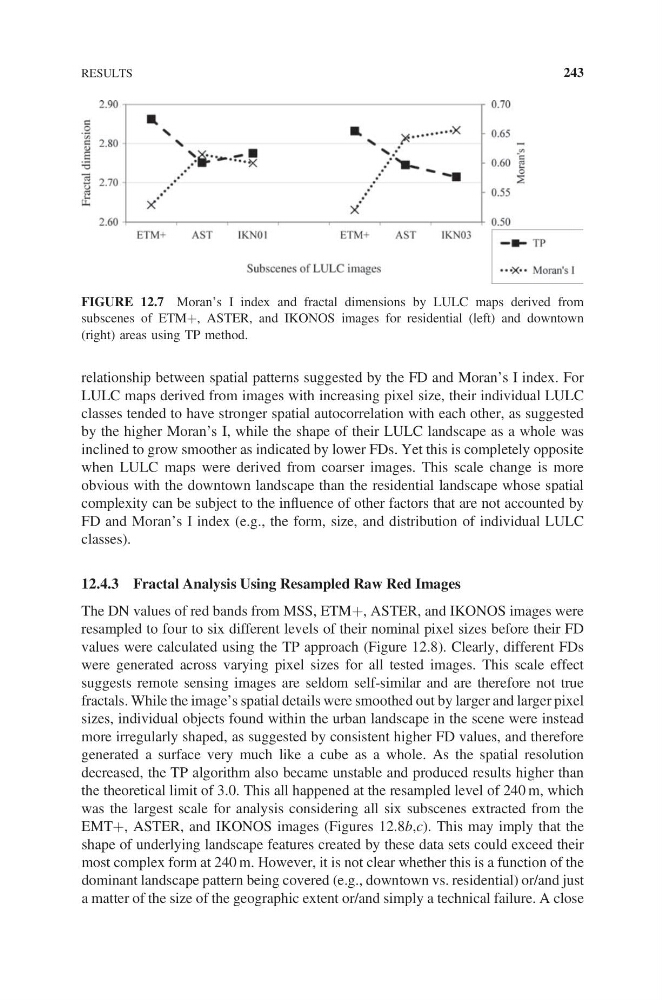
relationship between spatial patterns suggested by the FD and Moran’s I index. For
LULC maps derived from images with increasing pixel size, their individual LULC
classes tended to have stronger spatial autocorrelation with each other, as suggested
by the higher Moran’s I, while the shape of their LULC landscape as a whole was
inclined to grow smoother as indicated by lower FDs. Yet this is completely opposite
when LULC maps were derived from coarser images. This scale change is more
obvious with the downtown landscape than the residential landscape whose spatial
complexity can be subject to the influence of other factors that are not accounted by
FD and Moran’s I index (e.g., the form, size, and distribution of individual LULC
classes).
12.4.3 Fractal Analysis Using Resampled Raw Red Images
The DN values of red bands from MSS, ETM+, ASTER, and IKONOS images were
resampled to four to six different levels of their nominal pixel sizes before their FD
values were calculated using the TP approach (Figure 12.8). Clearly, different FDs
were generated across varying pixel sizes for all tested images. This scale effect
suggests remote sensing images are seldom self-similar and are therefore not true
fractals. While the image’s spatial details were smoothed out by larger and larger pixel
sizes, individual objects found within the urban landscape in the scene were instead
more irregularly shaped, as suggested by consistent higher FD values, and therefore
generated a surface very much like a cube as a whole. As the spatial resolution
decreased, the TP algorithm also became unstable and produced results higher than
the theoretical limit of 3.0. This all happened at the resampled level of 240 m, which
was the largest scale for analysis considering all six subscenes extracted from the
EMT+, ASTER, and IKONOS images (Figures 12.8b,c). This may imply that the
shape of underlying landscape features created by these data sets could exceed their
most complex form at 240 m. However, it is not clear whether this is a function of the
dominant landscape pattern being covered (e.g., downtown vs. residential) or/and just
a matter of the size of the geographic extent or/and simply a technical failure. A close
FIGURE 12.7 Moran’s I index and fractal dimensions by LULC maps derived from
subscenes of ETM+, ASTER, and IKONOS images for residential (left) and downtown
(right) areas using TP method.
RESULTS
243
LULC maps derived from images with increasing pixel size, their individual LULC
classes tended to have stronger spatial autocorrelation with each other, as suggested
by the higher Moran’s I, while the shape of their LULC landscape as a whole was
inclined to grow smoother as indicated by lower FDs. Yet this is completely opposite
when LULC maps were derived from coarser images. This scale change is more
obvious with the downtown landscape than the residential landscape whose spatial
complexity can be subject to the influence of other factors that are not accounted by
FD and Moran’s I index (e.g., the form, size, and distribution of individual LULC
classes).
12.4.3 Fractal Analysis Using Resampled Raw Red Images
The DN values of red bands from MSS, ETM+, ASTER, and IKONOS images were
resampled to four to six different levels of their nominal pixel sizes before their FD
values were calculated using the TP approach (Figure 12.8). Clearly, different FDs
were generated across varying pixel sizes for all tested images. This scale effect
suggests remote sensing images are seldom self-similar and are therefore not true
fractals. While the image’s spatial details were smoothed out by larger and larger pixel
sizes, individual objects found within the urban landscape in the scene were instead
more irregularly shaped, as suggested by consistent higher FD values, and therefore
generated a surface very much like a cube as a whole. As the spatial resolution
decreased, the TP algorithm also became unstable and produced results higher than
the theoretical limit of 3.0. This all happened at the resampled level of 240 m, which
was the largest scale for analysis considering all six subscenes extracted from the
EMT+, ASTER, and IKONOS images (Figures 12.8b,c). This may imply that the
shape of underlying landscape features created by these data sets could exceed their
most complex form at 240 m. However, it is not clear whether this is a function of the
dominant landscape pattern being covered (e.g., downtown vs. residential) or/and just
a matter of the size of the geographic extent or/and simply a technical failure. A close
FIGURE 12.7 Moran’s I index and fractal dimensions by LULC maps derived from
subscenes of ETM+, ASTER, and IKONOS images for residential (left) and downtown
(right) areas using TP method.
RESULTS
243