

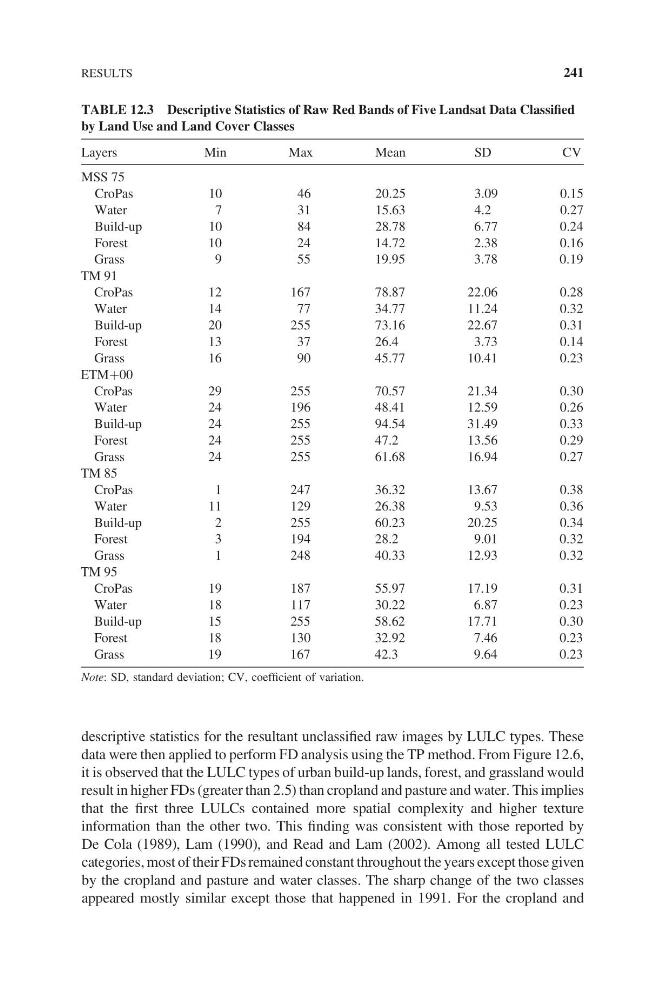
descriptive statistics for the resultant unclassified raw images by LULC types. These
data were then applied to perform FD analysis using the TP method. From Figure 12.6,
it is observed that the LULC types of urban build-up lands, forest, and grassland would
result in higher FDs (greater than 2.5) than cropland and pasture and water. This implies
that the first three LULCs contained more spatial complexity and higher texture
information than the other two. This finding was consistent with those reported by
De Cola (1989), Lam (1990), and Read and Lam (2002). Among all tested LULC
categories, most of their FDs remained constant throughout the years except those given
by the cropland and pasture and water classes. The sharp change of the two classes
appeared mostly similar except those that happened in 1991. For the cropland and
TABLE 12.3 Descriptive Statistics of Raw Red Bands of Five Landsat Data Classified
by Land Use and Land Cover Classes
Layers
Min
Max
Mean
SD
CV
MSS 75
CroPas
10
46
20.25
3.09
0.15
Water
7
31
15.63
4.2
0.27
Build-up
10
84
28.78
6.77
0.24
Forest
10
24
14.72
2.38
0.16
Grass
9
55
19.95
3.78
0.19
TM 91
CroPas
12
167
78.87
22.06
0.28
Water
14
77
34.77
11.24
0.32
Build-up
20
255
73.16
22.67
0.31
Forest
13
37
26.4
3.73
0.14
Grass
16
90
45.77
10.41
0.23
ETM+00
CroPas
29
255
70.57
21.34
0.30
Water
24
196
48.41
12.59
0.26
Build-up
24
255
94.54
31.49
0.33
Forest
24
255
47.2
13.56
0.29
Grass
24
255
61.68
16.94
0.27
TM 85
CroPas
1
247
36.32
13.67
0.38
Water
11
129
26.38
9.53
0.36
Build-up
2
255
60.23
20.25
0.34
Forest
3
194
28.2
9.01
0.32
Grass
1
248
40.33
12.93
0.32
TM 95
CroPas
19
187
55.97
17.19
0.31
Water
18
117
30.22
6.87
0.23
Build-up
15
255
58.62
17.71
0.30
Forest
18
130
32.92
7.46
0.23
Grass
19
167
42.3
9.64
0.23
Note: SD, standard deviation; CV, coefficient of variation.
RESULTS
241
data were then applied to perform FD analysis using the TP method. From Figure 12.6,
it is observed that the LULC types of urban build-up lands, forest, and grassland would
result in higher FDs (greater than 2.5) than cropland and pasture and water. This implies
that the first three LULCs contained more spatial complexity and higher texture
information than the other two. This finding was consistent with those reported by
De Cola (1989), Lam (1990), and Read and Lam (2002). Among all tested LULC
categories, most of their FDs remained constant throughout the years except those given
by the cropland and pasture and water classes. The sharp change of the two classes
appeared mostly similar except those that happened in 1991. For the cropland and
TABLE 12.3 Descriptive Statistics of Raw Red Bands of Five Landsat Data Classified
by Land Use and Land Cover Classes
Layers
Min
Max
Mean
SD
CV
MSS 75
CroPas
10
46
20.25
3.09
0.15
Water
7
31
15.63
4.2
0.27
Build-up
10
84
28.78
6.77
0.24
Forest
10
24
14.72
2.38
0.16
Grass
9
55
19.95
3.78
0.19
TM 91
CroPas
12
167
78.87
22.06
0.28
Water
14
77
34.77
11.24
0.32
Build-up
20
255
73.16
22.67
0.31
Forest
13
37
26.4
3.73
0.14
Grass
16
90
45.77
10.41
0.23
ETM+00
CroPas
29
255
70.57
21.34
0.30
Water
24
196
48.41
12.59
0.26
Build-up
24
255
94.54
31.49
0.33
Forest
24
255
47.2
13.56
0.29
Grass
24
255
61.68
16.94
0.27
TM 85
CroPas
1
247
36.32
13.67
0.38
Water
11
129
26.38
9.53
0.36
Build-up
2
255
60.23
20.25
0.34
Forest
3
194
28.2
9.01
0.32
Grass
1
248
40.33
12.93
0.32
TM 95
CroPas
19
187
55.97
17.19
0.31
Water
18
117
30.22
6.87
0.23
Build-up
15
255
58.62
17.71
0.30
Forest
18
130
32.92
7.46
0.23
Grass
19
167
42.3
9.64
0.23
Note: SD, standard deviation; CV, coefficient of variation.
RESULTS
241