

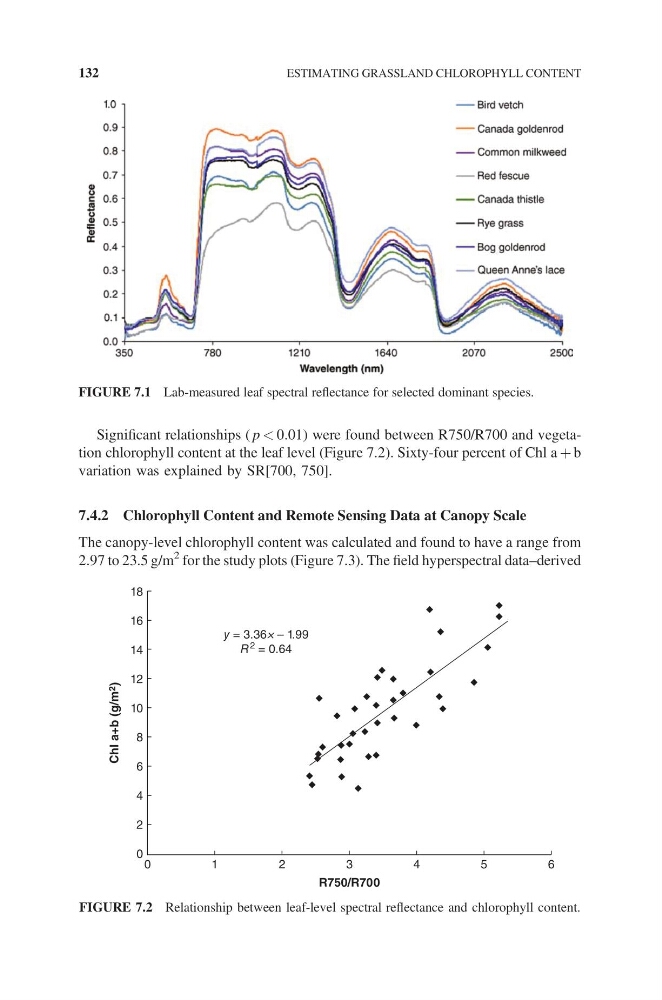
Significant relationships ( p < 0.01) were found between R750/R700 and vegetation chlorophyll content at the leaf level (Figure 7.2). Sixty-four percent of Chl a + b
variation was explained by SR[700, 750].
7.4.2 Chlorophyll Content and Remote Sensing Data at Canopy Scale
The canopy-level chlorophyll content was calculated and found to have a range from
2.97 to 23.5 g/m
2 for the study plots (Figure 7.3). The field hyperspectral data–derived
FIGURE 7.1 Lab-measured leaf spectral reflectance for selected dominant species.
18
16
14
12
10
8
6
4
2
0 0
1
2
y = 3.36× – 1.99
R
2 = 0.64
3
4
5
6
R750/R700
Chl a+b (g/m 2
)
FIGURE 7.2 Relationship between leaf-level spectral reflectance and chlorophyll content.
132
ESTIMATING GRASSLAND CHLOROPHYLL CONTENT
variation was explained by SR[700, 750].
7.4.2 Chlorophyll Content and Remote Sensing Data at Canopy Scale
The canopy-level chlorophyll content was calculated and found to have a range from
2.97 to 23.5 g/m
2 for the study plots (Figure 7.3). The field hyperspectral data–derived
FIGURE 7.1 Lab-measured leaf spectral reflectance for selected dominant species.
18
16
14
12
10
8
6
4
2
0 0
1
2
y = 3.36× – 1.99
R
2 = 0.64
3
4
5
6
R750/R700
Chl a+b (g/m 2
)
FIGURE 7.2 Relationship between leaf-level spectral reflectance and chlorophyll content.
132
ESTIMATING GRASSLAND CHLOROPHYLL CONTENT