

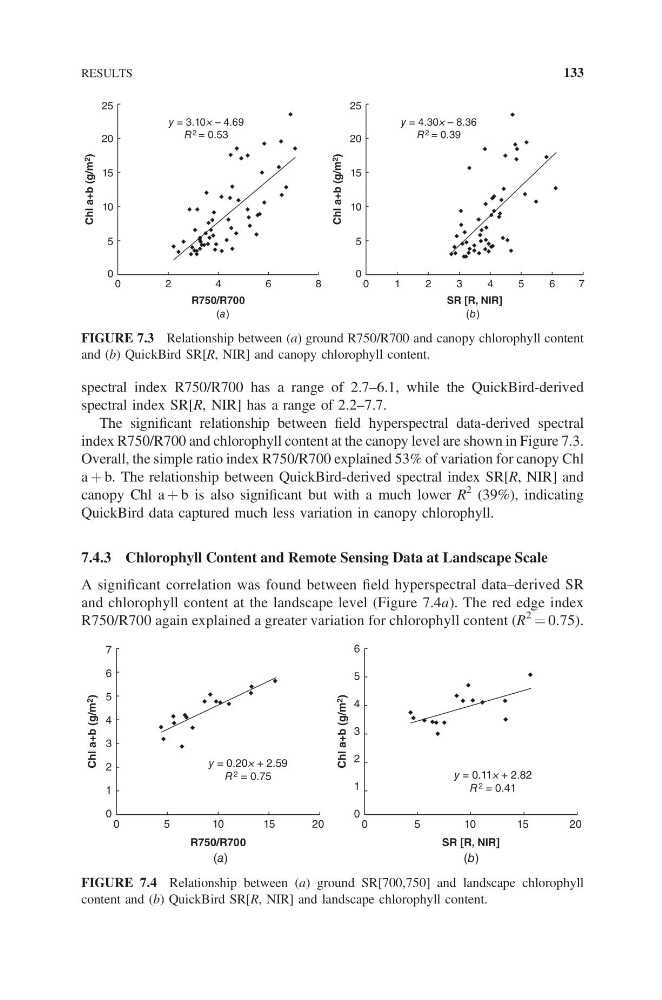
spectral index R750/R700 has a range of 2.7–6.1, while the QuickBird-derived
spectral index SR[R, NIR] has a range of 2.2–7.7.
The significant relationship between field hyperspectral data-derived spectral
index R750/R700 and chlorophyll content at the canopy level are shown in Figure 7.3.
Overall, the simple ratio index R750/R700 explained 53% of variation for canopy Chl
a + b. The relationship between QuickBird-derived spectral index SR[R, NIR] and
canopy Chl a + b is also significant but with a much lower R
2 (39%), indicating
QuickBird data captured much less variation in canopy chlorophyll.
7.4.3 Chlorophyll Content and Remote Sensing Data at Landscape Scale
A significant correlation was found between field hyperspectral data–derived SR
and chlorophyll content at the landscape level (Figure 7.4a). The red edge index
R750/R700 again explained a greater variation for chlorophyll content (R
2 = 0.75).
7
6
(a)
( b)
5
4
R750/R700
SR [R, NIR]
Chl a+b (g/m 2
)
Chl a+b (g/m 2
)
0
5
1 0
1 5
2 0
3
2
1
0
6
5
4
0
5
1 0
1 5
2 0
3
2
1
0
y = 0.11× + 2.82
R 2 = 0.41
y = 0.20× + 2.59
R 2 = 0.75
FIGURE 7.4 Relationship between (a) ground SR[700,750] and landscape chlorophyll
content and (b) QuickBird SR[R, NIR] and landscape chlorophyll content.
25
(a)
( b)
20
15
10
5
0
0
2
4
y = 3.10× – 4.69
R 2 = 0.53
y = 4.30× – 8.36
R 2 = 0.39
6
8
R750/R700
Chl a+b (g/m 2
)
Chl a+b (g/m 2
)
25
20
15
10
5
0
0
1
2
3
4
5
6
7
SR [R, NIR]
FIGURE 7.3 Relationship between (a) ground R750/R700 and canopy chlorophyll content
and (b) QuickBird SR[R, NIR] and canopy chlorophyll content.
RESULTS
133
spectral index SR[R, NIR] has a range of 2.2–7.7.
The significant relationship between field hyperspectral data-derived spectral
index R750/R700 and chlorophyll content at the canopy level are shown in Figure 7.3.
Overall, the simple ratio index R750/R700 explained 53% of variation for canopy Chl
a + b. The relationship between QuickBird-derived spectral index SR[R, NIR] and
canopy Chl a + b is also significant but with a much lower R
2 (39%), indicating
QuickBird data captured much less variation in canopy chlorophyll.
7.4.3 Chlorophyll Content and Remote Sensing Data at Landscape Scale
A significant correlation was found between field hyperspectral data–derived SR
and chlorophyll content at the landscape level (Figure 7.4a). The red edge index
R750/R700 again explained a greater variation for chlorophyll content (R
2 = 0.75).
7
6
(a)
( b)
5
4
R750/R700
SR [R, NIR]
Chl a+b (g/m 2
)
Chl a+b (g/m 2
)
0
5
1 0
1 5
2 0
3
2
1
0
6
5
4
0
5
1 0
1 5
2 0
3
2
1
0
y = 0.11× + 2.82
R 2 = 0.41
y = 0.20× + 2.59
R 2 = 0.75
FIGURE 7.4 Relationship between (a) ground SR[700,750] and landscape chlorophyll
content and (b) QuickBird SR[R, NIR] and landscape chlorophyll content.
25
(a)
( b)
20
15
10
5
0
0
2
4
y = 3.10× – 4.69
R 2 = 0.53
y = 4.30× – 8.36
R 2 = 0.39
6
8
R750/R700
Chl a+b (g/m 2
)
Chl a+b (g/m 2
)
25
20
15
10
5
0
0
1
2
3
4
5
6
7
SR [R, NIR]
FIGURE 7.3 Relationship between (a) ground R750/R700 and canopy chlorophyll content
and (b) QuickBird SR[R, NIR] and canopy chlorophyll content.
RESULTS
133