

from the Chl a + b contents of all the plots in a site. This canopy-integrated approach
was used in this study as it accounts for species heterogeneity and nongreen
components, such as dead litter and bare soil, which have a disproportionately strong
effect on canopy reflectance variability (He and Mui, 2010). In order to scale canopy
chlorophyll contents to the landscape level, canopy chlorophyll data were averaged
from plots to represent landscape-level chlorophyll contents (Chl landscape , in grams per
square meter).
7.3.5 Relating Remote Sensing Data to Chlorophyll Data
The relationship between grassland chlorophyll content and ground and satellite
remote sensing data at all scales were investigated using linear regression analysis,
where the regression was fit with the least-squares method. The coefficient of
determination (R
2
) was used to determine how much of the variation in vegetation
chlorophyll content can be explained by remote sensing data.
7.4 RESULTS
7.4.1 Chlorophyll Content and Laboratory Remote Sensing Data
at Leaf Scale
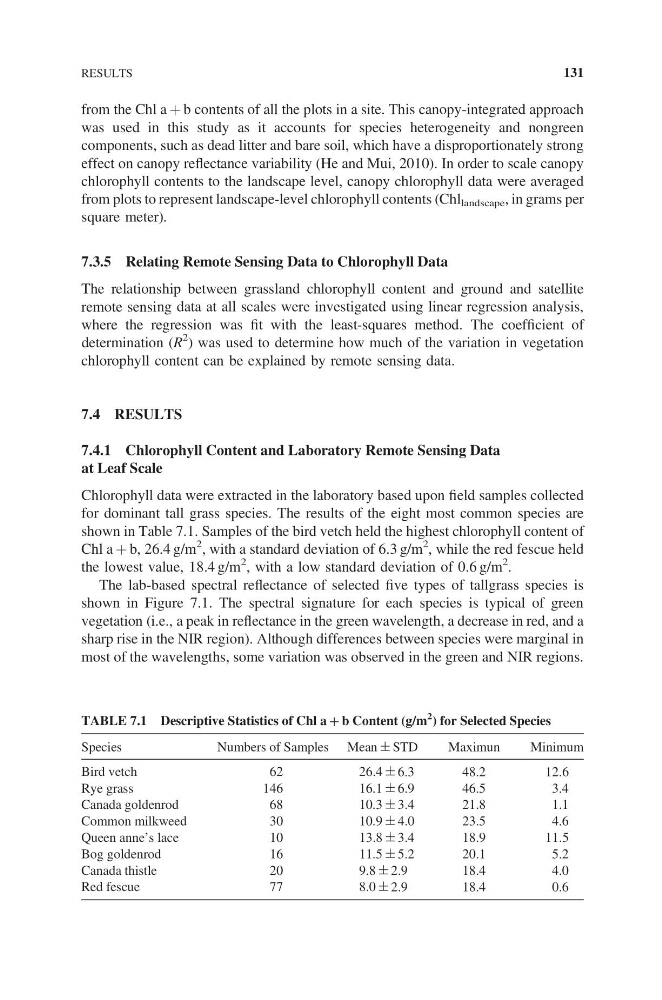
Chlorophyll data were extracted in the laboratory based upon field samples collected
for dominant tall grass species. The results of the eight most common species are
shown in Table 7.1. Samples of the bird vetch held the highest chlorophyll content of
Chl a + b, 26.4 g/m
2 , with a standard deviation of 6.3 g/m
2
, while the red fescue held
the lowest value, 18.4 g/m
2
, with a low standard deviation of 0.6 g/m
2 .
The lab-based spectral reflectance of selected five types of tallgrass species is
shown in Figure 7.1. The spectral signature for each species is typical of green
vegetation (i.e., a peak in reflectance in the green wavelength, a decrease in red, and a
sharp rise in the NIR region). Although differences between species were marginal in
most of the wavelengths, some variation was observed in the green and NIR regions.
TABLE 7.1 Descriptive Statistics of Chl a + b Content (g/m
2 ) for Selected Species
Species
Numbers of Samples Mean ± STD
Maximun
Minimum
Bird vetch
62
26.4 ± 6.3
48.2
12.6
Rye grass
146
16.1 ± 6.9
46.5
3.4
Canada goldenrod
68
10.3 ± 3.4
21.8
1.1
Common milkweed
30
10.9 ± 4.0
23.5
4.6
Queen anne’s lace
10
13.8 ± 3.4
18.9
11.5
Bog goldenrod
16
11.5 ± 5.2
20.1
5.2
Canada thistle
20
9.8 ± 2.9
18.4
4.0
Red fescue
77
8.0 ± 2.9
18.4
0.6
RESULTS
131
was used in this study as it accounts for species heterogeneity and nongreen
components, such as dead litter and bare soil, which have a disproportionately strong
effect on canopy reflectance variability (He and Mui, 2010). In order to scale canopy
chlorophyll contents to the landscape level, canopy chlorophyll data were averaged
from plots to represent landscape-level chlorophyll contents (Chl landscape , in grams per
square meter).
7.3.5 Relating Remote Sensing Data to Chlorophyll Data
The relationship between grassland chlorophyll content and ground and satellite
remote sensing data at all scales were investigated using linear regression analysis,
where the regression was fit with the least-squares method. The coefficient of
determination (R
2
) was used to determine how much of the variation in vegetation
chlorophyll content can be explained by remote sensing data.
7.4 RESULTS
7.4.1 Chlorophyll Content and Laboratory Remote Sensing Data
at Leaf Scale
Chlorophyll data were extracted in the laboratory based upon field samples collected
for dominant tall grass species. The results of the eight most common species are
shown in Table 7.1. Samples of the bird vetch held the highest chlorophyll content of
Chl a + b, 26.4 g/m
2 , with a standard deviation of 6.3 g/m
2
, while the red fescue held
the lowest value, 18.4 g/m
2
, with a low standard deviation of 0.6 g/m
2 .
The lab-based spectral reflectance of selected five types of tallgrass species is
shown in Figure 7.1. The spectral signature for each species is typical of green
vegetation (i.e., a peak in reflectance in the green wavelength, a decrease in red, and a
sharp rise in the NIR region). Although differences between species were marginal in
most of the wavelengths, some variation was observed in the green and NIR regions.
TABLE 7.1 Descriptive Statistics of Chl a + b Content (g/m
2 ) for Selected Species
Species
Numbers of Samples Mean ± STD
Maximun
Minimum
Bird vetch
62
26.4 ± 6.3
48.2
12.6
Rye grass
146
16.1 ± 6.9
46.5
3.4
Canada goldenrod
68
10.3 ± 3.4
21.8
1.1
Common milkweed
30
10.9 ± 4.0
23.5
4.6
Queen anne’s lace
10
13.8 ± 3.4
18.9
11.5
Bog goldenrod
16
11.5 ± 5.2
20.1
5.2
Canada thistle
20
9.8 ± 2.9
18.4
4.0
Red fescue
77
8.0 ± 2.9
18.4
0.6
RESULTS
131