

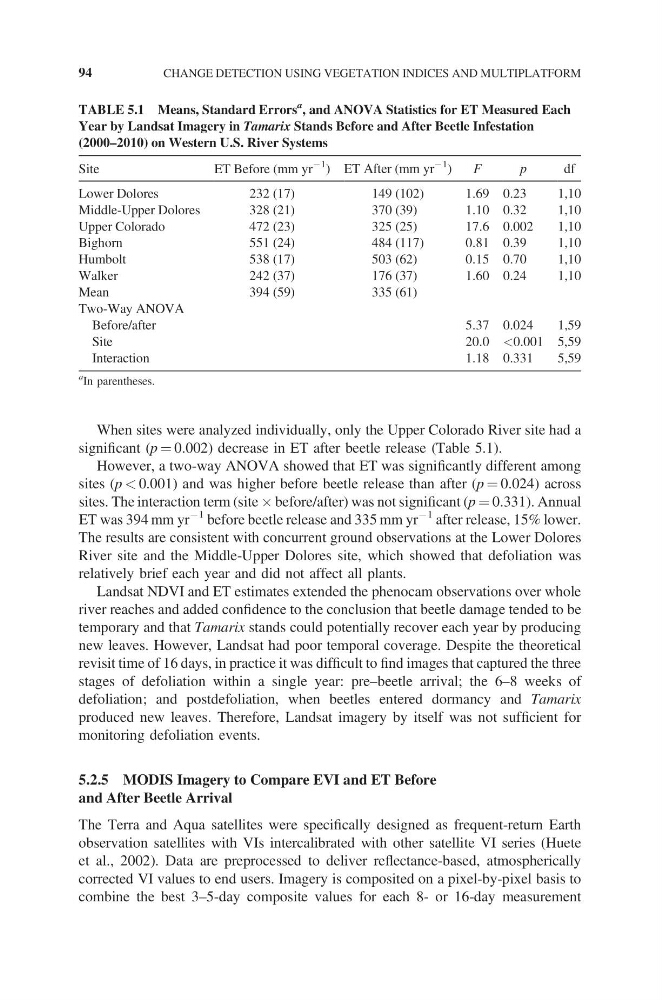
When sites were analyzed individually, only the Upper Colorado River site had a
significant (p = 0.002) decrease in ET after beetle release (Table 5.1).
However, a two-way ANOVA showed that ET was significantly different among
sites (p < 0.001) and was higher before beetle release than after (p = 0.024) across
sites. The interaction term (site ´ before/after) was not significant (p = 0.331). Annual
ET was 394 mm yr
−1 before beetle release and 335 mm yr
−1 after release, 15% lower.
The results are consistent with concurrent ground observations at the Lower Dolores
River site and the Middle-Upper Dolores site, which showed that defoliation was
relatively brief each year and did not affect all plants.
Landsat NDVI and ET estimates extended the phenocam observations over whole
river reaches and added confidence to the conclusion that beetle damage tended to be
temporary and that Tamarix stands could potentially recover each year by producing
new leaves. However, Landsat had poor temporal coverage. Despite the theoretical
revisit time of 16 days, in practice it was difficult to find images that captured the three
stages of defoliation within a single year: pre–beetle arrival; the 6–8 weeks of
defoliation; and postdefoliation, when beetles entered dormancy and Tamarix
produced new leaves. Therefore, Landsat imagery by itself was not sufficient for
monitoring defoliation events.
5.2.5 MODIS Imagery to Compare EVI and ET Before
and After Beetle Arrival
The Terra and Aqua satellites were specifically designed as frequent-return Earth
observation satellites with VIs intercalibrated with other satellite VI series (Huete
et al., 2002). Data are preprocessed to deliver reflectance-based, atmospherically
corrected VI values to end users. Imagery is composited on a pixel-by-pixel basis to
combine the best 3–5-day composite values for each 8- or 16-day measurement
TABLE 5.1 Means, Standard Errors
a , and ANOVA Statistics for ET Measured Each
Year by Landsat Imagery in Tamarix Stands Before and After Beetle Infestation
(2000–2010) on Western U.S. River Systems
Site
ET Before (mm yr
−1
) ET After (mm yr
−1
)
F
p
df
Lower Dolores
232 (17)
149 (102)
1.69 0.23
1,10
Middle-Upper Dolores
328 (21)
370 (39)
1.10 0.32
1,10
Upper Colorado
472 (23)
325 (25)
17.6 0.002
1,10
Bighorn
551 (24)
484 (117)
0.81 0.39
1,10
Humbolt
538 (17)
503 (62)
0.15 0.70
1,10
Walker
242 (37)
176 (37)
1.60 0.24
1,10
Mean
394 (59)
335 (61)
Two-Way ANOVA
Before/after
5.37 0.024
1,59
Site
20.0 <0.001 5,59
Interaction
1.18 0.331
5,59
a
In parentheses.
94
CHANGE DETECTION USING VEGETATION INDICES AND MULTIPLATFORM
significant (p = 0.002) decrease in ET after beetle release (Table 5.1).
However, a two-way ANOVA showed that ET was significantly different among
sites (p < 0.001) and was higher before beetle release than after (p = 0.024) across
sites. The interaction term (site ´ before/after) was not significant (p = 0.331). Annual
ET was 394 mm yr
−1 before beetle release and 335 mm yr
−1 after release, 15% lower.
The results are consistent with concurrent ground observations at the Lower Dolores
River site and the Middle-Upper Dolores site, which showed that defoliation was
relatively brief each year and did not affect all plants.
Landsat NDVI and ET estimates extended the phenocam observations over whole
river reaches and added confidence to the conclusion that beetle damage tended to be
temporary and that Tamarix stands could potentially recover each year by producing
new leaves. However, Landsat had poor temporal coverage. Despite the theoretical
revisit time of 16 days, in practice it was difficult to find images that captured the three
stages of defoliation within a single year: pre–beetle arrival; the 6–8 weeks of
defoliation; and postdefoliation, when beetles entered dormancy and Tamarix
produced new leaves. Therefore, Landsat imagery by itself was not sufficient for
monitoring defoliation events.
5.2.5 MODIS Imagery to Compare EVI and ET Before
and After Beetle Arrival
The Terra and Aqua satellites were specifically designed as frequent-return Earth
observation satellites with VIs intercalibrated with other satellite VI series (Huete
et al., 2002). Data are preprocessed to deliver reflectance-based, atmospherically
corrected VI values to end users. Imagery is composited on a pixel-by-pixel basis to
combine the best 3–5-day composite values for each 8- or 16-day measurement
TABLE 5.1 Means, Standard Errors
a , and ANOVA Statistics for ET Measured Each
Year by Landsat Imagery in Tamarix Stands Before and After Beetle Infestation
(2000–2010) on Western U.S. River Systems
Site
ET Before (mm yr
−1
) ET After (mm yr
−1
)
F
p
df
Lower Dolores
232 (17)
149 (102)
1.69 0.23
1,10
Middle-Upper Dolores
328 (21)
370 (39)
1.10 0.32
1,10
Upper Colorado
472 (23)
325 (25)
17.6 0.002
1,10
Bighorn
551 (24)
484 (117)
0.81 0.39
1,10
Humbolt
538 (17)
503 (62)
0.15 0.70
1,10
Walker
242 (37)
176 (37)
1.60 0.24
1,10
Mean
394 (59)
335 (61)
Two-Way ANOVA
Before/after
5.37 0.024
1,59
Site
20.0 <0.001 5,59
Interaction
1.18 0.331
5,59
a
In parentheses.
94
CHANGE DETECTION USING VEGETATION INDICES AND MULTIPLATFORM