

the year 2000 image for each image series and the same area was resampled on
subsequent images to evaluate the variability in the NDVI of the same scene across
images in a time series. In a test of the value of scaling NDVI for each image, Baugh
and Groeneveld (2006) compared NDVI
*
TM with unscaled NDVI for its correlation
with annual precipitation at 15 moisture flux tower sites in phreatophyte communities
from 1986 to 2002. Foliage density as determined by NDVI in desert plant
communities is expected to be correlated with annual rainfall. The coefficient of
determination (r
2
) between NDVI and precipitation was 0.37, compared to 0.77 for
precipitation and NDVI *
TM , and NDVI *
TM was better correlated with precipitation than
any of 13 other VIs tested in the same study. They concluded that NDVI *
TM corrected
for both atmospheric and soil-induced effects in an image series and eliminated the
need to correct for these two effects separately in this application.
Following Groeneveld et al. (2007), ET was calculated as in Equation (5.5).
Groeneveld et al. (2007) reported an r
2 of 0.94 for ET determined from single summer
Landsat images and annual ET measured at 15 moisture flux tower sites set in western
U.S. pheatophyte communities.
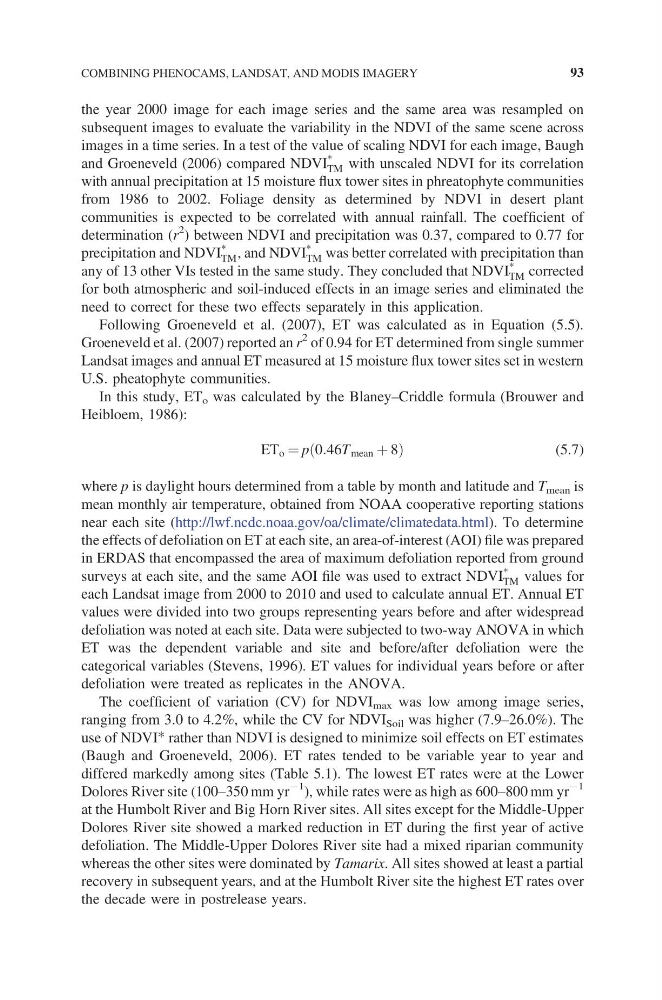
In this study, ET o was calculated by the Blaney–Criddle formula (Brouwer and
Heibloem, 1986):
ET o = p 0:46T mean + 8
(5.7)
where p is daylight hours determined from a table by month and latitude and T mean is
mean monthly air temperature, obtained from NOAA cooperative reporting stations
near each site (http://lwf.ncdc.noaa.gov/oa/climate/climatedata.html). To determine
the effects of defoliation on ET at each site, an area-of-interest (AOI) file was prepared
in ERDAS that encompassed the area of maximum defoliation reported from ground
surveys at each site, and the same AOI file was used to extract NDVI *
TM values for
each Landsat image from 2000 to 2010 and used to calculate annual ET. Annual ET
values were divided into two groups representing years before and after widespread
defoliation was noted at each site. Data were subjected to two-way ANOVA in which
ET was the dependent variable and site and before/after defoliation were the
categorical variables (Stevens, 1996). ET values for individual years before or after
defoliation were treated as replicates in the ANOVA.
The coefficient of variation (CV) for NDVI max was low among image series,
ranging from 3.0 to 4.2%, while the CV for NDVI Soil was higher (7.9–26.0%). The
use of NDVI* rather than NDVI is designed to minimize soil effects on ET estimates
(Baugh and Groeneveld, 2006). ET rates tended to be variable year to year and
differed markedly among sites (Table 5.1). The lowest ET rates were at the Lower
Dolores River site (100–350 mm yr
−1
), while rates were as high as 600–800 mm yr
−1
at the Humbolt River and Big Horn River sites. All sites except for the Middle-Upper
Dolores River site showed a marked reduction in ET during the first year of active
defoliation. The Middle-Upper Dolores River site had a mixed riparian community
whereas the other sites were dominated by Tamarix. All sites showed at least a partial
recovery in subsequent years, and at the Humbolt River site the highest ET rates over
the decade were in postrelease years.
COMBINING PHENOCAMS, LANDSAT, AND MODIS IMAGERY
93
subsequent images to evaluate the variability in the NDVI of the same scene across
images in a time series. In a test of the value of scaling NDVI for each image, Baugh
and Groeneveld (2006) compared NDVI
*
TM with unscaled NDVI for its correlation
with annual precipitation at 15 moisture flux tower sites in phreatophyte communities
from 1986 to 2002. Foliage density as determined by NDVI in desert plant
communities is expected to be correlated with annual rainfall. The coefficient of
determination (r
2
) between NDVI and precipitation was 0.37, compared to 0.77 for
precipitation and NDVI *
TM , and NDVI *
TM was better correlated with precipitation than
any of 13 other VIs tested in the same study. They concluded that NDVI *
TM corrected
for both atmospheric and soil-induced effects in an image series and eliminated the
need to correct for these two effects separately in this application.
Following Groeneveld et al. (2007), ET was calculated as in Equation (5.5).
Groeneveld et al. (2007) reported an r
2 of 0.94 for ET determined from single summer
Landsat images and annual ET measured at 15 moisture flux tower sites set in western
U.S. pheatophyte communities.
In this study, ET o was calculated by the Blaney–Criddle formula (Brouwer and
Heibloem, 1986):
ET o = p 0:46T mean + 8
(5.7)
where p is daylight hours determined from a table by month and latitude and T mean is
mean monthly air temperature, obtained from NOAA cooperative reporting stations
near each site (http://lwf.ncdc.noaa.gov/oa/climate/climatedata.html). To determine
the effects of defoliation on ET at each site, an area-of-interest (AOI) file was prepared
in ERDAS that encompassed the area of maximum defoliation reported from ground
surveys at each site, and the same AOI file was used to extract NDVI *
TM values for
each Landsat image from 2000 to 2010 and used to calculate annual ET. Annual ET
values were divided into two groups representing years before and after widespread
defoliation was noted at each site. Data were subjected to two-way ANOVA in which
ET was the dependent variable and site and before/after defoliation were the
categorical variables (Stevens, 1996). ET values for individual years before or after
defoliation were treated as replicates in the ANOVA.
The coefficient of variation (CV) for NDVI max was low among image series,
ranging from 3.0 to 4.2%, while the CV for NDVI Soil was higher (7.9–26.0%). The
use of NDVI* rather than NDVI is designed to minimize soil effects on ET estimates
(Baugh and Groeneveld, 2006). ET rates tended to be variable year to year and
differed markedly among sites (Table 5.1). The lowest ET rates were at the Lower
Dolores River site (100–350 mm yr
−1
), while rates were as high as 600–800 mm yr
−1
at the Humbolt River and Big Horn River sites. All sites except for the Middle-Upper
Dolores River site showed a marked reduction in ET during the first year of active
defoliation. The Middle-Upper Dolores River site had a mixed riparian community
whereas the other sites were dominated by Tamarix. All sites showed at least a partial
recovery in subsequent years, and at the Humbolt River site the highest ET rates over
the decade were in postrelease years.
COMBINING PHENOCAMS, LANDSAT, AND MODIS IMAGERY
93