

Conservation planning in a changing world
173
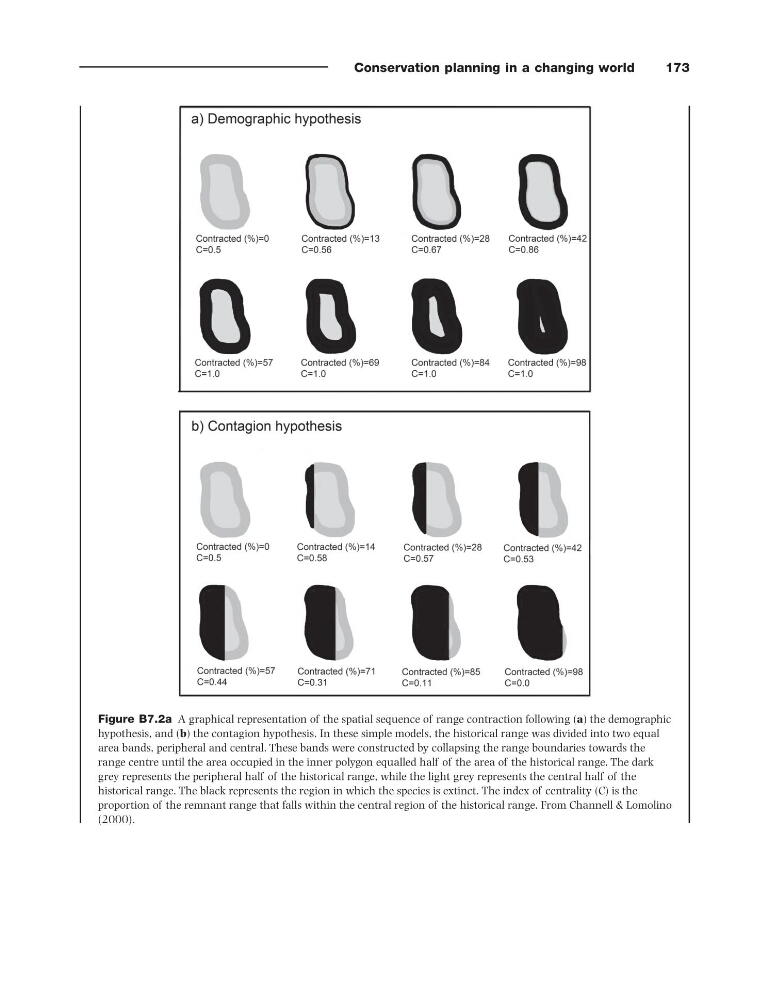
Figure B7.2a A graphical representation of the spatial sequence of range contraction following ( a ) the demographic
hypothesis, and ( b ) the contagion hypothesis. In these simple models, the historical range was divided into two equal
area bands, peripheral and central. These bands were constructed by collapsing the range boundaries towards the
range centre until the area occupied in the inner polygon equalled half of the area of the historical range. The dark
grey represents the peripheral half of the historical range, while the light grey represents the central half of the
historical range. The black represents the region in which the species is extinct. The index of centrality (C) is the
proportion of the remnant range that falls within the central region of the historical range. From Channell & Lomolino
( 2000 ).
173
Figure B7.2a A graphical representation of the spatial sequence of range contraction following ( a ) the demographic
hypothesis, and ( b ) the contagion hypothesis. In these simple models, the historical range was divided into two equal
area bands, peripheral and central. These bands were constructed by collapsing the range boundaries towards the
range centre until the area occupied in the inner polygon equalled half of the area of the historical range. The dark
grey represents the peripheral half of the historical range, while the light grey represents the central half of the
historical range. The black represents the region in which the species is extinct. The index of centrality (C) is the
proportion of the remnant range that falls within the central region of the historical range. From Channell & Lomolino
( 2000 ).