

172
Planning for persistence in a changing world
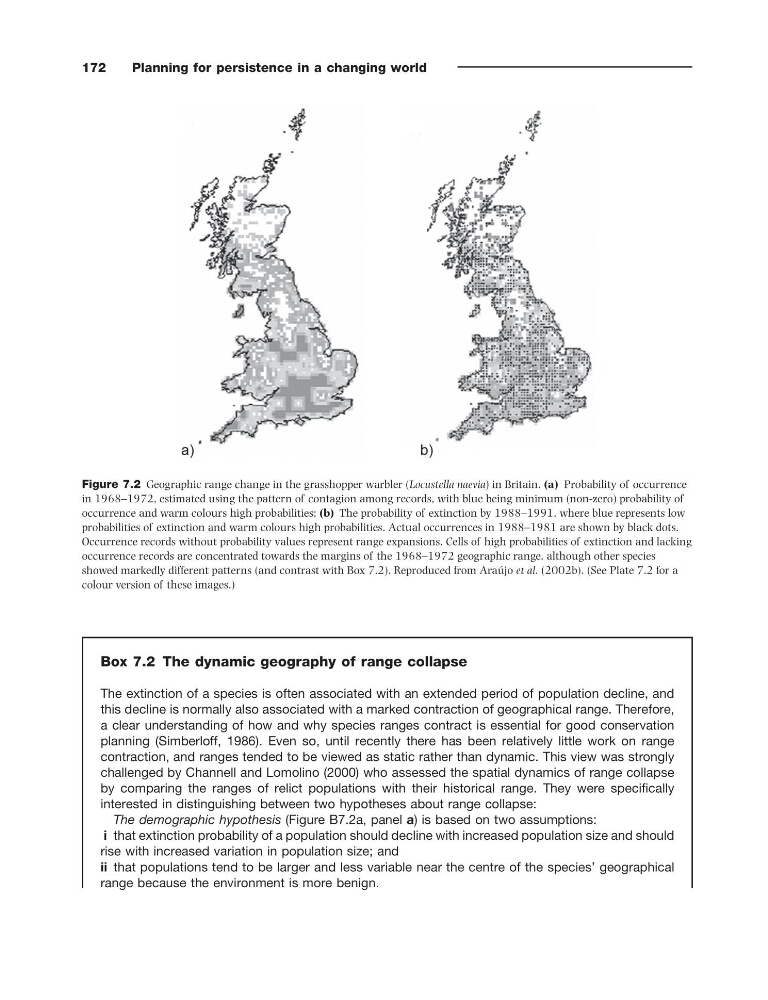
Figure 7.2 Geographic range change in the grasshopper warbler ( Locustella naevia ) in Britain. (a) Probability of occurrence
in 1968 – 1972, estimated using the pattern of contagion among records, with blue being minimum (non - zero) probability of
occurrence and warm colours high probabilities; (b) The probability of extinction by 1988 – 1991, where blue represents low
probabilities of extinction and warm colours high probabilities. Actual occurrences in 1988 – 1981 are shown by black dots.
Occurrence records without probability values represent range expansions. Cells of high probabilities of extinction and lacking
occurrence records are concentrated towards the margins of the 1968 – 1972 geographic range, although other species
showed markedly different patterns (and contrast with Box 7.2 ). Reproduced from Ara ú jo et al. (2002b) . (See Plate 7.2 for a
colour version of these images.)
Box 7.2 The d ynamic g eography of r ange c ollapse
The extinction of a species is often associated with an extended period of population decline, and
this decline is normally also associated with a marked contraction of geographical range. Therefore,
a clear understanding of how and why species ranges contract is essential for good conservation
planning (Simberloff, 1986 ). Even so, until recently there has been relatively little work on range
contraction, and ranges tended to be viewed as static rather than dynamic. This view was strongly
challenged by Channell and Lomolino (2000) who assessed the spatial dynamics of range collapse
by comparing the ranges of relict populations with their historical range. They were specifi cally
interested in distinguishing between two hypotheses about range collapse:
The demographic hypothesis (Figure B7.2a , panel a ) is based on two assumptions:
i that extinction probability of a population should decline with increased population size and should
rise with increased variation in population size; and
ii that populations tend to be larger and less variable near the centre of the species ’ geographical
range because the environment is more benign.
Planning for persistence in a changing world
Figure 7.2 Geographic range change in the grasshopper warbler ( Locustella naevia ) in Britain. (a) Probability of occurrence
in 1968 – 1972, estimated using the pattern of contagion among records, with blue being minimum (non - zero) probability of
occurrence and warm colours high probabilities; (b) The probability of extinction by 1988 – 1991, where blue represents low
probabilities of extinction and warm colours high probabilities. Actual occurrences in 1988 – 1981 are shown by black dots.
Occurrence records without probability values represent range expansions. Cells of high probabilities of extinction and lacking
occurrence records are concentrated towards the margins of the 1968 – 1972 geographic range, although other species
showed markedly different patterns (and contrast with Box 7.2 ). Reproduced from Ara ú jo et al. (2002b) . (See Plate 7.2 for a
colour version of these images.)
Box 7.2 The d ynamic g eography of r ange c ollapse
The extinction of a species is often associated with an extended period of population decline, and
this decline is normally also associated with a marked contraction of geographical range. Therefore,
a clear understanding of how and why species ranges contract is essential for good conservation
planning (Simberloff, 1986 ). Even so, until recently there has been relatively little work on range
contraction, and ranges tended to be viewed as static rather than dynamic. This view was strongly
challenged by Channell and Lomolino (2000) who assessed the spatial dynamics of range collapse
by comparing the ranges of relict populations with their historical range. They were specifi cally
interested in distinguishing between two hypotheses about range collapse:
The demographic hypothesis (Figure B7.2a , panel a ) is based on two assumptions:
i that extinction probability of a population should decline with increased population size and should
rise with increased variation in population size; and
ii that populations tend to be larger and less variable near the centre of the species ’ geographical
range because the environment is more benign.