

618
Climatic Geomorphology
A
BEE
....
II
,9
i ii
C 1
A 1
B 1 E 1 D 1
D
CO 2ppmv
240220 -
200 -
180_
\
"t
'"
I
''
I' ......
I
0
50000
100000
150000
AT ~
-
2
0
-2
-4
-6
-8
- -10
years B.P.
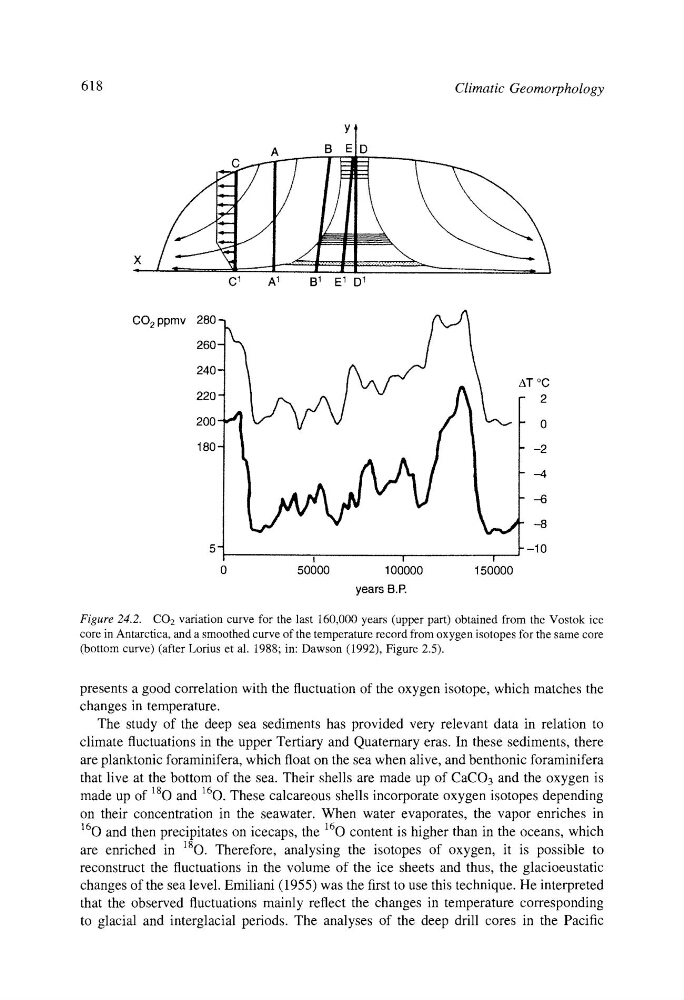
Figure 24.2. CO 2 variation curve for the last 160,000 years (upper part) obtained from the Vostok ice
core in Antarctica, and a smoothed curve of the temperature record from oxygen isotopes for the same core
(bottom curve) (after Lorius et al. 1988; in: Dawson (1992), Figure 2.5).
presents a good correlation with the fluctuation of the oxygen isotope, which matches the
changes in temperature.
The study of the deep sea sediments has provided very relevant data in relation to
climate fluctuations in the upper Tertiary and Quaternary eras. In these sediments, there
are planktonic foraminifera, which float on the sea when alive, and benthonic foraminifera
that live at the bottom of the sea. Their shells are made up of CaCO3 and the oxygen is
made up of 180 and 160. These calcareous shells incorporate oxygen isotopes depending
on their concentration in the seawater. When water evaporates, the vapor enriches in
160 and then precipitates on icecaps, the 160 content is higher than in the oceans, which
are enriched in 180. Therefore, analysing the isotopes of oxygen, it is possible to
reconstruct the fluctuations in the volume of the ice sheets and thus, the glacioeustatic
changes of the sea level. Emiliani (1955) was the first to use this technique. He interpreted
that the observed fluctuations mainly reflect the changes in temperature corresponding
to glacial and interglacial periods. The analyses of the deep drill cores in the Pacific