

606
Climatic Geomorphology
intense erosion. Intrinsic thresholds operate inside the system, as when there is a continuous
supply of particles on a slope, which then reaches a critical threshold of instability. In
some cases, these geomorphologic thresholds can be quantitatively defined and used as
the basis for the recognition of potentially unstable landscapes (Schumm, 1979). On
the other hand, because connections inside a geomorphic system are so complex, when
an external change takes place, it spreads over the system in a complex way (complex
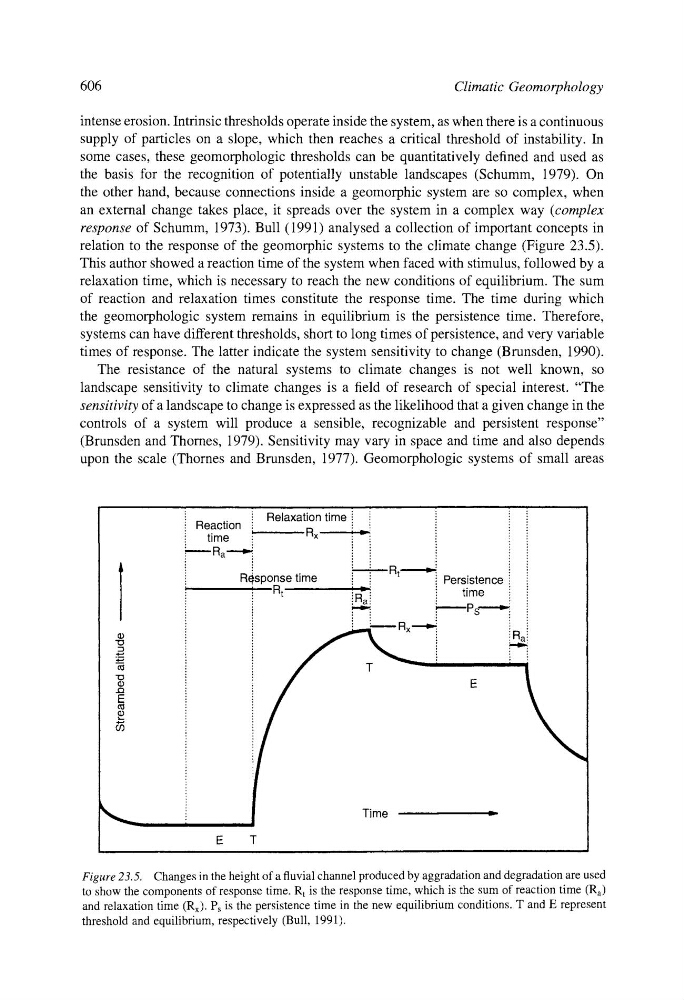
response of Schumm, 1973). Bull (1991) analysed a collection of important concepts in
relation to the response of the geomorphic systems to the climate change (Figure 23.5).
This author showed a reaction time of the system when faced with stimulus, followed by a
relaxation time, which is necessary to reach the new conditions of equilibrium. The sum
of reaction and relaxation times constitute the response time. The time during which
the geomorphologic system remains in equilibrium is the persistence time. Therefore,
systems can have different thresholds, short to long times of persistence, and very variable
times of response. The latter indicate the system sensitivity to change (Brunsden, 1990).
The resistance of the natural systems to climate changes is not well known, so
landscape sensitivity to climate changes is a field of research of special interest. "The
sensitivity of a landscape to change is expressed as the likelihood that a given change in the
controls of a system will produce a sensible, recognizable and persistent response"
(Brunsden and Thornes, 1979). Sensitivity may vary in space and time and also depends
upon the scale (Thornes and Brunsden, 1977). Geomorphologic systems of small areas
,,
Relaxation time
:
Reaction
time
~
Rx
=-:
aa .-.....~.,
R$sponse time
L
Rt
,,.._,
iaal
i
Rt
~:
.
~ Persistence
!
time
I
Ps
-
,
i
!Ra
,
~
,
,
!
E
T
Figure 23.5. Changes in the height of a fluvial channel produced by aggradation and degradation are used
to show the components of response time. R t is the response time, which is the sum of reaction time (Ra)
and relaxation time (Rx). Ps is the persistence time in the new equilibrium conditions. T and E represent
threshold and equilibrium, respectively (Bull, 1991).