

Résumé
185
2.7.Erosion rate calculation
The advantage of the DSAS tool is that it gives a graphical and statistical evolution of the
coastline. It provides a standardized method to trace statistical evolution while analyzing past
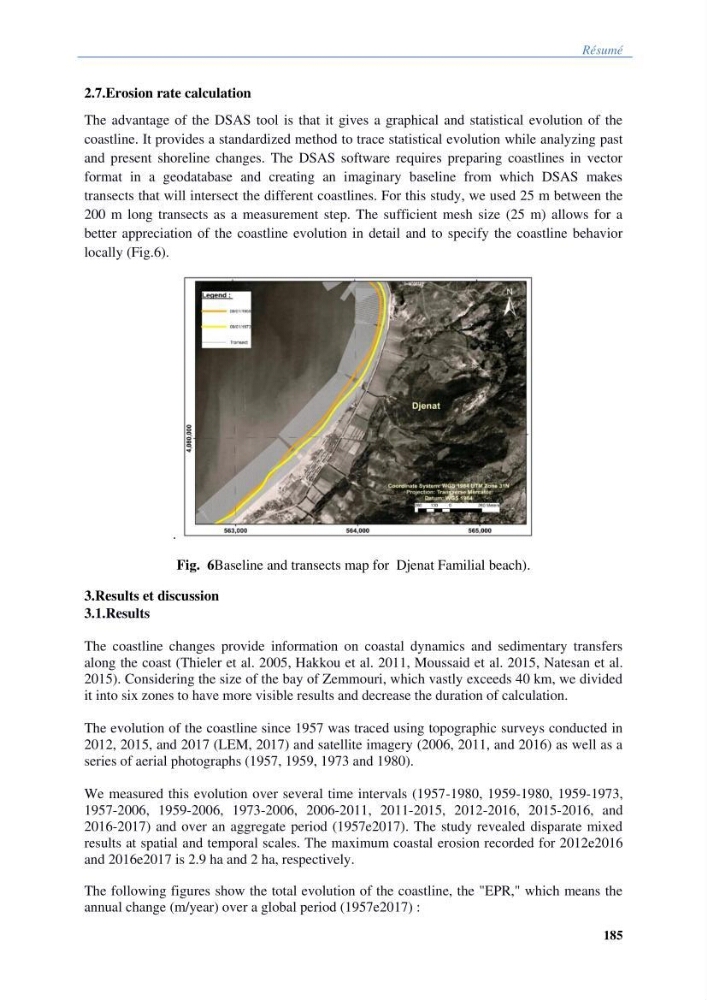
and present shoreline changes. The DSAS software requires preparing coastlines in vector
format in a geodatabase and creating an imaginary baseline from which DSAS makes
transects that will intersect the different coastlines. For this study, we used 25 m between the
200 m long transects as a measurement step. The sufficient mesh size (25 m) allows for a
better appreciation of the coastline evolution in detail and to specify the coastline behavior
locally (Fig.6).
.
Fig. 6Baseline and transects map for Djenat Familial beach).
3.Results et discussion
3.1.Results
The coastline changes provide information on coastal dynamics and sedimentary transfers
along the coast (Thieler et al. 2005, Hakkou et al. 2011, Moussaid et al. 2015, Natesan et al.
2015). Considering the size of the bay of Zemmouri, which vastly exceeds 40 km, we divided
it into six zones to have more visible results and decrease the duration of calculation.
The evolution of the coastline since 1957 was traced using topographic surveys conducted in
2012, 2015, and 2017 (LEM, 2017) and satellite imagery (2006, 2011, and 2016) as well as a
series of aerial photographs (1957, 1959, 1973 and 1980).
We measured this evolution over several time intervals (1957-1980, 1959-1980, 1959-1973,
1957-2006, 1959-2006, 1973-2006, 2006-2011, 2011-2015, 2012-2016, 2015-2016, and
2016-2017) and over an aggregate period (1957e2017). The study revealed disparate mixed
results at spatial and temporal scales. The maximum coastal erosion recorded for 2012e2016
and 2016e2017 is 2.9 ha and 2 ha, respectively.
The following figures show the total evolution of the coastline, the "EPR," which means the
annual change (m/year) over a global period (1957e2017) :
185
2.7.Erosion rate calculation
The advantage of the DSAS tool is that it gives a graphical and statistical evolution of the
coastline. It provides a standardized method to trace statistical evolution while analyzing past
and present shoreline changes. The DSAS software requires preparing coastlines in vector
format in a geodatabase and creating an imaginary baseline from which DSAS makes
transects that will intersect the different coastlines. For this study, we used 25 m between the
200 m long transects as a measurement step. The sufficient mesh size (25 m) allows for a
better appreciation of the coastline evolution in detail and to specify the coastline behavior
locally (Fig.6).
.
Fig. 6Baseline and transects map for Djenat Familial beach).
3.Results et discussion
3.1.Results
The coastline changes provide information on coastal dynamics and sedimentary transfers
along the coast (Thieler et al. 2005, Hakkou et al. 2011, Moussaid et al. 2015, Natesan et al.
2015). Considering the size of the bay of Zemmouri, which vastly exceeds 40 km, we divided
it into six zones to have more visible results and decrease the duration of calculation.
The evolution of the coastline since 1957 was traced using topographic surveys conducted in
2012, 2015, and 2017 (LEM, 2017) and satellite imagery (2006, 2011, and 2016) as well as a
series of aerial photographs (1957, 1959, 1973 and 1980).
We measured this evolution over several time intervals (1957-1980, 1959-1980, 1959-1973,
1957-2006, 1959-2006, 1973-2006, 2006-2011, 2011-2015, 2012-2016, 2015-2016, and
2016-2017) and over an aggregate period (1957e2017). The study revealed disparate mixed
results at spatial and temporal scales. The maximum coastal erosion recorded for 2012e2016
and 2016e2017 is 2.9 ha and 2 ha, respectively.
The following figures show the total evolution of the coastline, the "EPR," which means the
annual change (m/year) over a global period (1957e2017) :