

wind. Consequently, coasts with low hydrodynamics are
sensitive and threatened and should be inventoried as a
matter of priority (Mauvais and Goarnisson 1999;
Dutrieux et al. 2000; Le Berre et al. 2010). The variables
that are taken into account in the construction of this
index are the coastal exposure to swell and wind.
– Pollution intensity (Ip): The quality of coastal waters is
directly linked to continental inputs. It is necessary to
always associate a coastal marine area with the drained
watersheds (Mauvais and Goarnisson 1999). To assess
pollution intensity, we followed the approach proposed
by Abbasov and Smakhtin (2012). We used 10 variables:
dissolved oxygen (DO), oxygen saturation rate (%), total
suspended matter (TSM), nitrate (NO
−
3 ), phosphate
(PO
−3
4 ), zinc (Zn), cadmium (Cd), lead (Pb), total coliforms, and fecal coliforms.
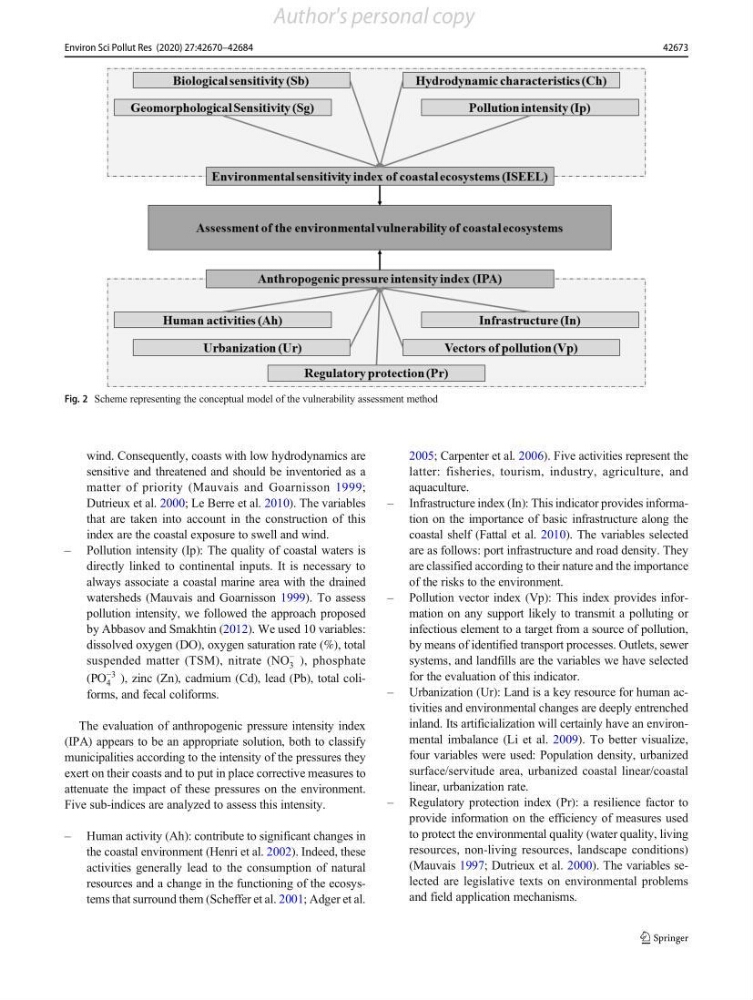
The evaluation of anthropogenic pressure intensity index
(IPA) appears to be an appropriate solution, both to classify
municipalities according to the intensity of the pressures they
exert on their coasts and to put in place corrective measures to
attenuate the impact of these pressures on the environment.
Five sub-indices are analyzed to assess this intensity.
– Human activity (Ah): contribute to significant changes in
the coastal environment (Henri et al. 2002). Indeed, these
activities generally lead to the consumption of natural
resources and a change in the functioning of the ecosystems that surround them (Scheffer et al. 2001; Adger et al.
2005; Carpenter et al. 2006). Five activities represent the
latter: fisheries, tourism, industry, agriculture, and
aquaculture.
– Infrastructure index (In): This indicator provides information on the importance of basic infrastructure along the
coastal shelf (Fattal et al. 2010). The variables selected
are as follows: port infrastructure and road density. They
are classified according to their nature and the importance
of the risks to the environment.
– Pollution vector index (Vp): This index provides information on any support likely to transmit a polluting or
infectious element to a target from a source of pollution,
by means of identified transport processes. Outlets, sewer
systems, and landfills are the variables we have selected
for the evaluation of this indicator.
– Urbanization (Ur): Land is a key resource for human activities and environmental changes are deeply entrenched
inland. Its artificialization will certainly have an environmental imbalance (Li et al. 2009). To better visualize,
four variables were used: Population density, urbanized
surface/servitude area, urbanized coastal linear/coastal
linear, urbanization rate.
– Regulatory protection index (Pr): a resilience factor to
provide information on the efficiency of measures used
to protect the environmental quality (water quality, living
resources, non-living resources, landscape conditions)
(Mauvais 1997; Dutrieux et al. 2000). The variables selected are legislative texts on environmental problems
and field application mechanisms.
Fig. 2 Scheme representing the conceptual model of the vulnerability assessment method
42673
Environ Sci Pollut Res (2020) 27:42670–42684
Author's personal copy
sensitive and threatened and should be inventoried as a
matter of priority (Mauvais and Goarnisson 1999;
Dutrieux et al. 2000; Le Berre et al. 2010). The variables
that are taken into account in the construction of this
index are the coastal exposure to swell and wind.
– Pollution intensity (Ip): The quality of coastal waters is
directly linked to continental inputs. It is necessary to
always associate a coastal marine area with the drained
watersheds (Mauvais and Goarnisson 1999). To assess
pollution intensity, we followed the approach proposed
by Abbasov and Smakhtin (2012). We used 10 variables:
dissolved oxygen (DO), oxygen saturation rate (%), total
suspended matter (TSM), nitrate (NO
−
3 ), phosphate
(PO
−3
4 ), zinc (Zn), cadmium (Cd), lead (Pb), total coliforms, and fecal coliforms.
The evaluation of anthropogenic pressure intensity index
(IPA) appears to be an appropriate solution, both to classify
municipalities according to the intensity of the pressures they
exert on their coasts and to put in place corrective measures to
attenuate the impact of these pressures on the environment.
Five sub-indices are analyzed to assess this intensity.
– Human activity (Ah): contribute to significant changes in
the coastal environment (Henri et al. 2002). Indeed, these
activities generally lead to the consumption of natural
resources and a change in the functioning of the ecosystems that surround them (Scheffer et al. 2001; Adger et al.
2005; Carpenter et al. 2006). Five activities represent the
latter: fisheries, tourism, industry, agriculture, and
aquaculture.
– Infrastructure index (In): This indicator provides information on the importance of basic infrastructure along the
coastal shelf (Fattal et al. 2010). The variables selected
are as follows: port infrastructure and road density. They
are classified according to their nature and the importance
of the risks to the environment.
– Pollution vector index (Vp): This index provides information on any support likely to transmit a polluting or
infectious element to a target from a source of pollution,
by means of identified transport processes. Outlets, sewer
systems, and landfills are the variables we have selected
for the evaluation of this indicator.
– Urbanization (Ur): Land is a key resource for human activities and environmental changes are deeply entrenched
inland. Its artificialization will certainly have an environmental imbalance (Li et al. 2009). To better visualize,
four variables were used: Population density, urbanized
surface/servitude area, urbanized coastal linear/coastal
linear, urbanization rate.
– Regulatory protection index (Pr): a resilience factor to
provide information on the efficiency of measures used
to protect the environmental quality (water quality, living
resources, non-living resources, landscape conditions)
(Mauvais 1997; Dutrieux et al. 2000). The variables selected are legislative texts on environmental problems
and field application mechanisms.
Fig. 2 Scheme representing the conceptual model of the vulnerability assessment method
42673
Environ Sci Pollut Res (2020) 27:42670–42684
Author's personal copy