

Data collection
Environmental sensitivity data
A stratified systematic sampling plan related to the state and
typology of the bottom of the area has been developed to extract
the data (Guit et al. 2015, 2016). The practical benefits of this
approach are the uniform distribution of sampling units over the
entire study area and the resulting ease of identification, displacement, and significant gains in accuracy (Samalens 2009). In order
to establish this sampling technique, two criteria were taken into
account: distance from the coast and the spatial order “geographical area” (Bigot 2006).
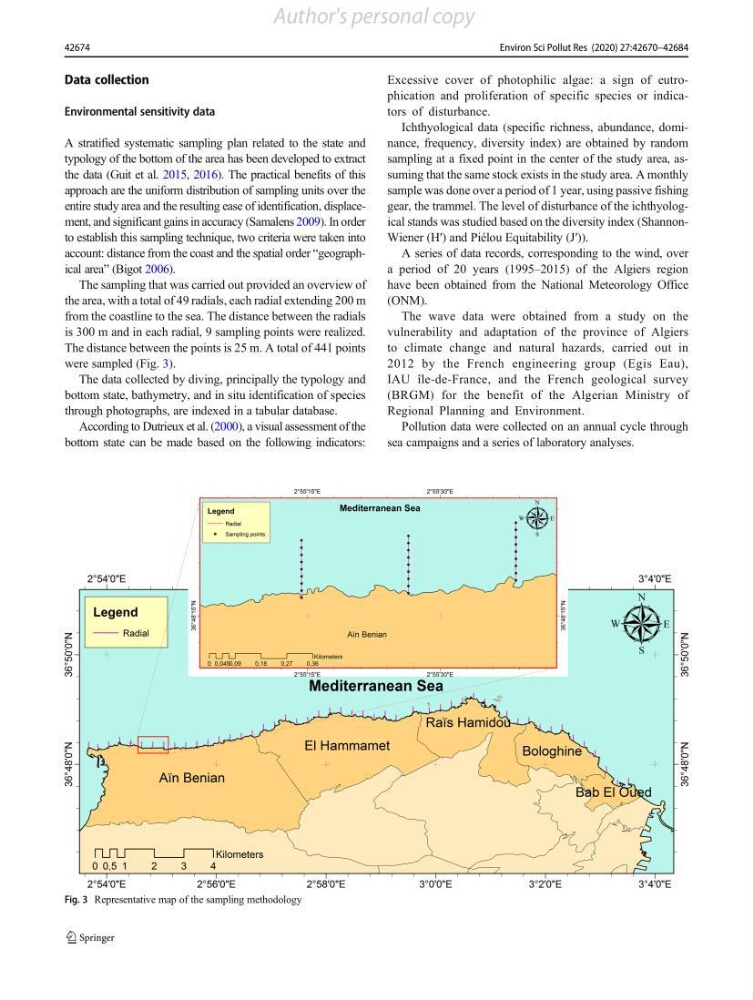
The sampling that was carried out provided an overview of
the area, with a total of 49 radials, each radial extending 200 m
from the coastline to the sea. The distance between the radials
is 300 m and in each radial, 9 sampling points were realized.
The distance between the points is 25 m. A total of 441 points
were sampled (Fig. 3).
The data collected by diving, principally the typology and
bottom state, bathymetry, and in situ identification of species
through photographs, are indexed in a tabular database.
According to Dutrieux et al. (2000), a visual assessment of the
bottom state can be made based on the following indicators:
Excessive cover of photophilic algae: a sign of eutrophication and proliferation of specific species or indicators of disturbance.
Ichthyological data (specific richness, abundance, dominance, frequency, diversity index) are obtained by random
sampling at a fixed point in the center of the study area, assuming that the same stock exists in the study area. A monthly
sample was done over a period of 1 year, using passive fishing
gear, the trammel. The level of disturbance of the ichthyological stands was studied based on the diversity index (ShannonWiener (H′) and Piélou Equitability (J′)).
A series of data records, corresponding to the wind, over
a period of 20 years (1995–2015) of the Algiers region
have been obtained from the National Meteorology Office
(ONM).
The wave data were obtained from a study on the
vulnerability and adaptation of the province of Algiers
to climate change and natural hazards, carried out in
2012 by the French engineering group (Egis Eau),
IAU île-de-France, and the French geological survey
(BRGM) for the benefit of the Algerian Ministry of
Regional Planning and Environment.
Pollution data were collected on an annual cycle through
sea campaigns and a series of laboratory analyses.
Fig. 3 Representative map of the sampling methodology
42674
Environ Sci Pollut Res (2020) 27:42670–42684
Author's personal copy
Environmental sensitivity data
A stratified systematic sampling plan related to the state and
typology of the bottom of the area has been developed to extract
the data (Guit et al. 2015, 2016). The practical benefits of this
approach are the uniform distribution of sampling units over the
entire study area and the resulting ease of identification, displacement, and significant gains in accuracy (Samalens 2009). In order
to establish this sampling technique, two criteria were taken into
account: distance from the coast and the spatial order “geographical area” (Bigot 2006).
The sampling that was carried out provided an overview of
the area, with a total of 49 radials, each radial extending 200 m
from the coastline to the sea. The distance between the radials
is 300 m and in each radial, 9 sampling points were realized.
The distance between the points is 25 m. A total of 441 points
were sampled (Fig. 3).
The data collected by diving, principally the typology and
bottom state, bathymetry, and in situ identification of species
through photographs, are indexed in a tabular database.
According to Dutrieux et al. (2000), a visual assessment of the
bottom state can be made based on the following indicators:
Excessive cover of photophilic algae: a sign of eutrophication and proliferation of specific species or indicators of disturbance.
Ichthyological data (specific richness, abundance, dominance, frequency, diversity index) are obtained by random
sampling at a fixed point in the center of the study area, assuming that the same stock exists in the study area. A monthly
sample was done over a period of 1 year, using passive fishing
gear, the trammel. The level of disturbance of the ichthyological stands was studied based on the diversity index (ShannonWiener (H′) and Piélou Equitability (J′)).
A series of data records, corresponding to the wind, over
a period of 20 years (1995–2015) of the Algiers region
have been obtained from the National Meteorology Office
(ONM).
The wave data were obtained from a study on the
vulnerability and adaptation of the province of Algiers
to climate change and natural hazards, carried out in
2012 by the French engineering group (Egis Eau),
IAU île-de-France, and the French geological survey
(BRGM) for the benefit of the Algerian Ministry of
Regional Planning and Environment.
Pollution data were collected on an annual cycle through
sea campaigns and a series of laboratory analyses.
Fig. 3 Representative map of the sampling methodology
42674
Environ Sci Pollut Res (2020) 27:42670–42684
Author's personal copy