

Continental Shelf Research 232 (2022) 104629
10
fortnight of February. A precise computation of this chronology along
the entire Algerian coast (data not shown) shows that this central position is relatively stable from 1
◦
W to 8.7
◦
E (with minor variability <1
fortnight). In contrast, there is a positive shift of almost a fortnight (first
fortnight of March) between 3
◦
W and 1
◦
W near the Alboran Sea, where a
maximum shift of two fortnights is observed (data not shown). The
productive season is more extended, due to the higher nutrient content
of Atlantic waters.
We know that winter mixing due to wind and currents is the main
cause of nutrient availability in the euphotic layer of the region (Conan
et al., 2018; Fernandez et al., 2006; Kessouri et al., 2018; Millot, 1989).
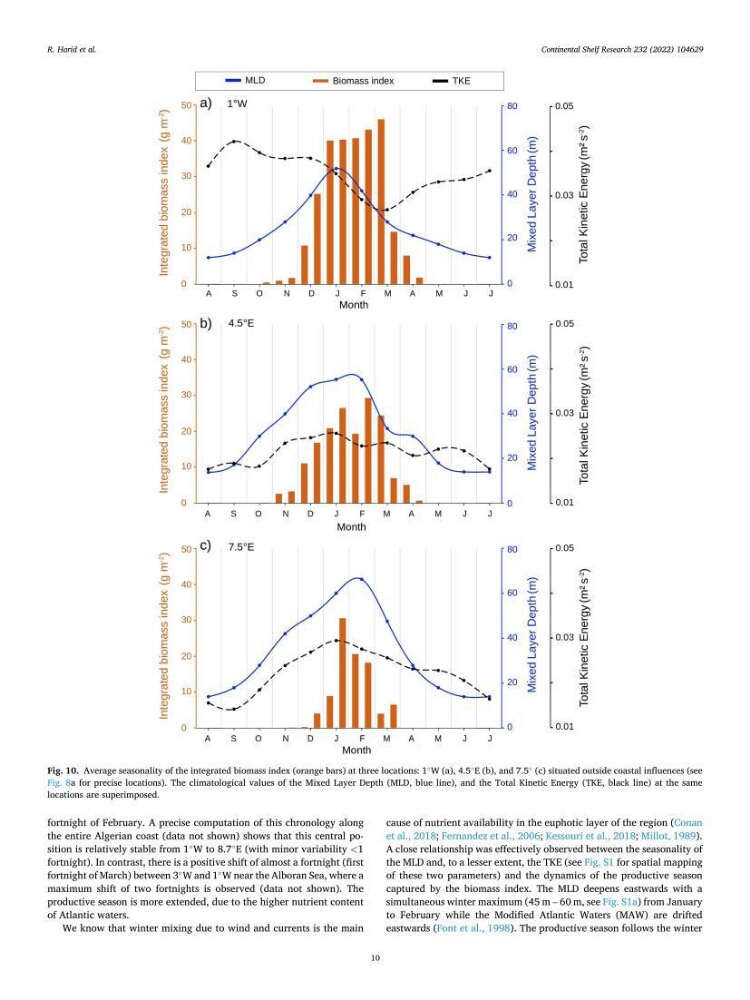
A close relationship was effectively observed between the seasonality of
the MLD and, to a lesser extent, the TKE (see Fig. S1 for spatial mapping
of these two parameters) and the dynamics of the productive season
captured by the biomass index. The MLD deepens eastwards with a
simultaneous winter maximum (45 m – 60 m, see Fig. S1a) from January
to February while the Modified Atlantic Waters (MAW) are drifted
eastwards (Font et al., 1998). The productive season follows the winter
Fig. 10. Average seasonality of the integrated biomass index (orange bars) at three locations: 1
◦
W (a), 4.5
◦
E (b), and 7.5
◦
(c) situated outside coastal influences (see
Fig. 8a for precise locations). The climatological values of the Mixed Layer Depth (MLD, blue line), and the Total Kinetic Energy (TKE, black line) at the same
locations are superimposed.
R. Harid et al.
10
fortnight of February. A precise computation of this chronology along
the entire Algerian coast (data not shown) shows that this central position is relatively stable from 1
◦
W to 8.7
◦
E (with minor variability <1
fortnight). In contrast, there is a positive shift of almost a fortnight (first
fortnight of March) between 3
◦
W and 1
◦
W near the Alboran Sea, where a
maximum shift of two fortnights is observed (data not shown). The
productive season is more extended, due to the higher nutrient content
of Atlantic waters.
We know that winter mixing due to wind and currents is the main
cause of nutrient availability in the euphotic layer of the region (Conan
et al., 2018; Fernandez et al., 2006; Kessouri et al., 2018; Millot, 1989).
A close relationship was effectively observed between the seasonality of
the MLD and, to a lesser extent, the TKE (see Fig. S1 for spatial mapping
of these two parameters) and the dynamics of the productive season
captured by the biomass index. The MLD deepens eastwards with a
simultaneous winter maximum (45 m – 60 m, see Fig. S1a) from January
to February while the Modified Atlantic Waters (MAW) are drifted
eastwards (Font et al., 1998). The productive season follows the winter
Fig. 10. Average seasonality of the integrated biomass index (orange bars) at three locations: 1
◦
W (a), 4.5
◦
E (b), and 7.5
◦
(c) situated outside coastal influences (see
Fig. 8a for precise locations). The climatological values of the Mixed Layer Depth (MLD, blue line), and the Total Kinetic Energy (TKE, black line) at the same
locations are superimposed.
R. Harid et al.