

Continental Shelf Research 232 (2022) 104629
11
mixing (average MLD >20 m, blue line) by about one month in the
western and central part of the region (Fig. 10a–b). At the same time, a
relative synchrony is progressively reached further East (Fig. 10c). The
TKE (computed from geostrophic currents, i.e., including eddy energy
and permanent currents) is almost permanently high at 1
◦
W near the
Alboran Sea (Fig. 10a) and not in phase with the biomass index.
It is very likely that, along with the significant enrichment effect of
the MAW, water mixing is an important factor in the initiation of surface
productivity but is probably not a limiting factor near the Alboran Sea
with high-energy levels related to both Alboran gyres. Lower energy
levels are observed further East at 4.5
◦
E (Fig. 10b) with a slight relationship to the biomass index, while a higher association is observed at
7.5
◦
E (Fig. 10c). This well-defined seasonal pattern explains that the
higher MLD (50–60 m) observed in January–February, induces a rapid
mixing of surface waters and a rapid increase in planktonic biomass
during the second half of February. Average wind speed (data not
shown) do not show any relationship with the surface water mixing,
with low winter wind values from October to February. The MAW trajectory determines the large-scale variability of planktonic biomass in
the AB. It is strongly constrained by nutrient availability, while the
different sources of coastal enrichment represent a significant contribution throughout the year and unexpected relative importance of about
two-thirds during the central part of the productive season and progressively higher during the rest of the year.
4.2. Sources of coastal enrichment
Previous studies using Chl-a variability as a proxy of the phytoplankton biomass variability along the Algerian basin have focused on
large spatial scales, mainly over the continental shelf (Mayot et al.,
2016; Pieri et al., 2015; Salgado-Hernanz et al., 2019). They have
generally ignored small scales and coastal waters, except locally for
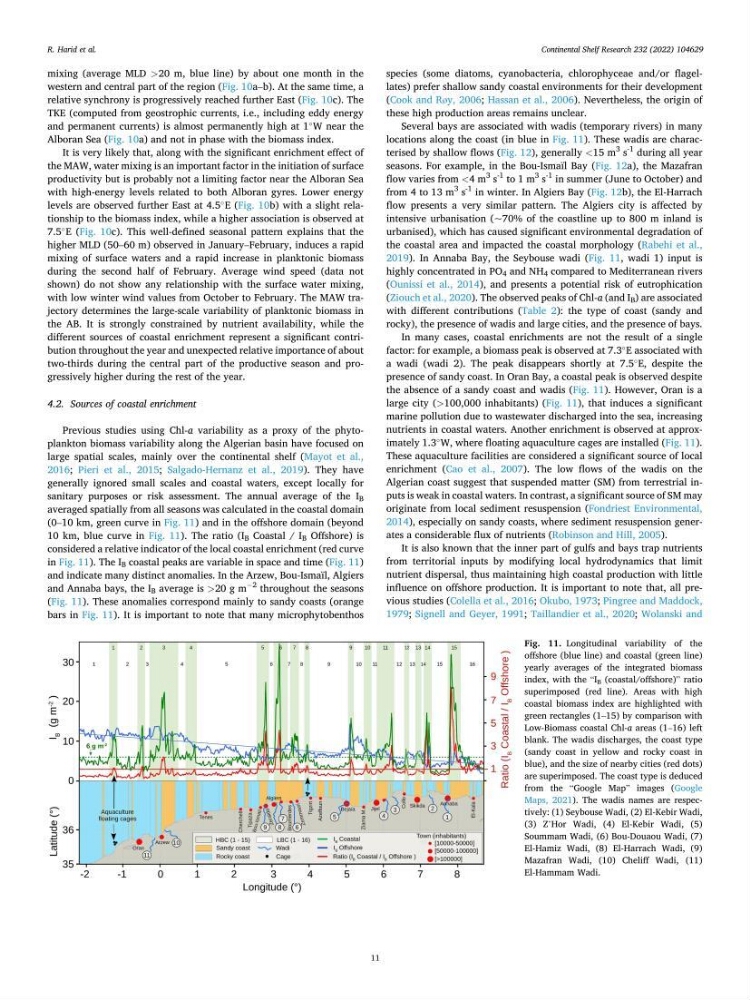
sanitary purposes or risk assessment. The annual average of the I B
averaged spatially from all seasons was calculated in the coastal domain
(0–10 km, green curve in Fig. 11) and in the offshore domain (beyond
10 km, blue curve in Fig. 11). The ratio (I B Coastal / I B Offshore) is
considered a relative indicator of the local coastal enrichment (red curve
in Fig. 11). The I B coastal peaks are variable in space and time (Fig. 11)
and indicate many distinct anomalies. In the Arzew, Bou-Ismaïl, Algiers
and Annaba bays, the I B average is >20 g m
−2
throughout the seasons
(Fig. 11). These anomalies correspond mainly to sandy coasts (orange
bars in Fig. 11). It is important to note that many microphytobenthos
species (some diatoms, cyanobacteria, chlorophyceae and/or flagellates) prefer shallow sandy coastal environments for their development
(Cook and Røy, 2006; Hassan et al., 2006). Nevertheless, the origin of
these high production areas remains unclear.
Several bays are associated with wadis (temporary rivers) in many
locations along the coast (in blue in Fig. 11). These wadis are characterised by shallow flows (Fig. 12), generally <15 m
3
s
-1
during all year
seasons. For example, in the Bou-Ismaïl Bay (Fig. 12a), the Mazafran
flow varies from <4 m
3
s
-1
to 1 m
3
s
-1
in summer (June to October) and
from 4 to 13 m
3
s
-1
in winter. In Algiers Bay (Fig. 12b), the El-Harrach
flow presents a very similar pattern. The Algiers city is affected by
intensive urbanisation (~70% of the coastline up to 800 m inland is
urbanised), which has caused significant environmental degradation of
the coastal area and impacted the coastal morphology (Rabehi et al.,
2019). In Annaba Bay, the Seybouse wadi (Fig. 11, wadi 1) input is
highly concentrated in PO 4 and NH 4 compared to Mediterranean rivers
(Ounissi et al., 2014), and presents a potential risk of eutrophication
(Ziouch et al., 2020). The observed peaks of Chl-a (and I B ) are associated
with different contributions (Table 2): the type of coast (sandy and
rocky), the presence of wadis and large cities, and the presence of bays.
In many cases, coastal enrichments are not the result of a single
factor: for example, a biomass peak is observed at 7.3
◦
E associated with
a wadi (wadi 2). The peak disappears shortly at 7.5
◦
E, despite the
presence of sandy coast. In Oran Bay, a coastal peak is observed despite
the absence of a sandy coast and wadis (Fig. 11). However, Oran is a
large city (>100,000 inhabitants) (Fig. 11), that induces a significant
marine pollution due to wastewater discharged into the sea, increasing
nutrients in coastal waters. Another enrichment is observed at approximately 1.3
◦
W, where floating aquaculture cages are installed (Fig. 11).
These aquaculture facilities are considered a significant source of local
enrichment (Cao et al., 2007). The low flows of the wadis on the
Algerian coast suggest that suspended matter (SM) from terrestrial inputs is weak in coastal waters. In contrast, a significant source of SM may
originate from local sediment resuspension (Fondriest Environmental,
2014), especially on sandy coasts, where sediment resuspension generates a considerable flux of nutrients (Robinson and Hill, 2005).
It is also known that the inner part of gulfs and bays trap nutrients
from territorial inputs by modifying local hydrodynamics that limit
nutrient dispersal, thus maintaining high coastal production with little
influence on offshore production. It is important to note that, all previous studies (Colella et al., 2016; Okubo, 1973; Pingree and Maddock,
1979; Signell and Geyer, 1991; Taillandier et al., 2020; Wolanski and
Fig. 11. Longitudinal variability of the
offshore (blue line) and coastal (green line)
yearly averages of the integrated biomass
index, with the “I B (coastal/offshore)” ratio
superimposed (red line). Areas with high
coastal biomass index are highlighted with
green rectangles (1–15) by comparison with
Low-Biomass coastal Chl-a areas (1–16) left
blank. The wadis discharges, the coast type
(sandy coast in yellow and rocky coast in
blue), and the size of nearby cities (red dots)
are superimposed. The coast type is deduced
from the “Google Map” images (Google
Maps, 2021). The wadis names are respectively: (1) Seybouse Wadi, (2) El-Kebir Wadi,
(3) Z’Hor Wadi, (4) El-Kebir Wadi, (5)
Soummam Wadi, (6) Bou-Douaou Wadi, (7)
El-Hamiz Wadi, (8) El-Harrach Wadi, (9)
Mazafran Wadi, (10) Cheliff Wadi, (11)
El-Hammam Wadi.
R. Harid et al.
11
mixing (average MLD >20 m, blue line) by about one month in the
western and central part of the region (Fig. 10a–b). At the same time, a
relative synchrony is progressively reached further East (Fig. 10c). The
TKE (computed from geostrophic currents, i.e., including eddy energy
and permanent currents) is almost permanently high at 1
◦
W near the
Alboran Sea (Fig. 10a) and not in phase with the biomass index.
It is very likely that, along with the significant enrichment effect of
the MAW, water mixing is an important factor in the initiation of surface
productivity but is probably not a limiting factor near the Alboran Sea
with high-energy levels related to both Alboran gyres. Lower energy
levels are observed further East at 4.5
◦
E (Fig. 10b) with a slight relationship to the biomass index, while a higher association is observed at
7.5
◦
E (Fig. 10c). This well-defined seasonal pattern explains that the
higher MLD (50–60 m) observed in January–February, induces a rapid
mixing of surface waters and a rapid increase in planktonic biomass
during the second half of February. Average wind speed (data not
shown) do not show any relationship with the surface water mixing,
with low winter wind values from October to February. The MAW trajectory determines the large-scale variability of planktonic biomass in
the AB. It is strongly constrained by nutrient availability, while the
different sources of coastal enrichment represent a significant contribution throughout the year and unexpected relative importance of about
two-thirds during the central part of the productive season and progressively higher during the rest of the year.
4.2. Sources of coastal enrichment
Previous studies using Chl-a variability as a proxy of the phytoplankton biomass variability along the Algerian basin have focused on
large spatial scales, mainly over the continental shelf (Mayot et al.,
2016; Pieri et al., 2015; Salgado-Hernanz et al., 2019). They have
generally ignored small scales and coastal waters, except locally for
sanitary purposes or risk assessment. The annual average of the I B
averaged spatially from all seasons was calculated in the coastal domain
(0–10 km, green curve in Fig. 11) and in the offshore domain (beyond
10 km, blue curve in Fig. 11). The ratio (I B Coastal / I B Offshore) is
considered a relative indicator of the local coastal enrichment (red curve
in Fig. 11). The I B coastal peaks are variable in space and time (Fig. 11)
and indicate many distinct anomalies. In the Arzew, Bou-Ismaïl, Algiers
and Annaba bays, the I B average is >20 g m
−2
throughout the seasons
(Fig. 11). These anomalies correspond mainly to sandy coasts (orange
bars in Fig. 11). It is important to note that many microphytobenthos
species (some diatoms, cyanobacteria, chlorophyceae and/or flagellates) prefer shallow sandy coastal environments for their development
(Cook and Røy, 2006; Hassan et al., 2006). Nevertheless, the origin of
these high production areas remains unclear.
Several bays are associated with wadis (temporary rivers) in many
locations along the coast (in blue in Fig. 11). These wadis are characterised by shallow flows (Fig. 12), generally <15 m
3
s
-1
during all year
seasons. For example, in the Bou-Ismaïl Bay (Fig. 12a), the Mazafran
flow varies from <4 m
3
s
-1
to 1 m
3
s
-1
in summer (June to October) and
from 4 to 13 m
3
s
-1
in winter. In Algiers Bay (Fig. 12b), the El-Harrach
flow presents a very similar pattern. The Algiers city is affected by
intensive urbanisation (~70% of the coastline up to 800 m inland is
urbanised), which has caused significant environmental degradation of
the coastal area and impacted the coastal morphology (Rabehi et al.,
2019). In Annaba Bay, the Seybouse wadi (Fig. 11, wadi 1) input is
highly concentrated in PO 4 and NH 4 compared to Mediterranean rivers
(Ounissi et al., 2014), and presents a potential risk of eutrophication
(Ziouch et al., 2020). The observed peaks of Chl-a (and I B ) are associated
with different contributions (Table 2): the type of coast (sandy and
rocky), the presence of wadis and large cities, and the presence of bays.
In many cases, coastal enrichments are not the result of a single
factor: for example, a biomass peak is observed at 7.3
◦
E associated with
a wadi (wadi 2). The peak disappears shortly at 7.5
◦
E, despite the
presence of sandy coast. In Oran Bay, a coastal peak is observed despite
the absence of a sandy coast and wadis (Fig. 11). However, Oran is a
large city (>100,000 inhabitants) (Fig. 11), that induces a significant
marine pollution due to wastewater discharged into the sea, increasing
nutrients in coastal waters. Another enrichment is observed at approximately 1.3
◦
W, where floating aquaculture cages are installed (Fig. 11).
These aquaculture facilities are considered a significant source of local
enrichment (Cao et al., 2007). The low flows of the wadis on the
Algerian coast suggest that suspended matter (SM) from terrestrial inputs is weak in coastal waters. In contrast, a significant source of SM may
originate from local sediment resuspension (Fondriest Environmental,
2014), especially on sandy coasts, where sediment resuspension generates a considerable flux of nutrients (Robinson and Hill, 2005).
It is also known that the inner part of gulfs and bays trap nutrients
from territorial inputs by modifying local hydrodynamics that limit
nutrient dispersal, thus maintaining high coastal production with little
influence on offshore production. It is important to note that, all previous studies (Colella et al., 2016; Okubo, 1973; Pingree and Maddock,
1979; Signell and Geyer, 1991; Taillandier et al., 2020; Wolanski and
Fig. 11. Longitudinal variability of the
offshore (blue line) and coastal (green line)
yearly averages of the integrated biomass
index, with the “I B (coastal/offshore)” ratio
superimposed (red line). Areas with high
coastal biomass index are highlighted with
green rectangles (1–15) by comparison with
Low-Biomass coastal Chl-a areas (1–16) left
blank. The wadis discharges, the coast type
(sandy coast in yellow and rocky coast in
blue), and the size of nearby cities (red dots)
are superimposed. The coast type is deduced
from the “Google Map” images (Google
Maps, 2021). The wadis names are respectively: (1) Seybouse Wadi, (2) El-Kebir Wadi,
(3) Z’Hor Wadi, (4) El-Kebir Wadi, (5)
Soummam Wadi, (6) Bou-Douaou Wadi, (7)
El-Hamiz Wadi, (8) El-Harrach Wadi, (9)
Mazafran Wadi, (10) Cheliff Wadi, (11)
El-Hammam Wadi.
R. Harid et al.