

Continental Shelf Research 232 (2022) 104629
9
4.1.2. Coastal enrichment
Beyond the spatially averaged seasonal signal computed in both
domains (Fig. 7a), the results give precise insights about their regional
alongshore variability, which is well distinguished by the biomass index
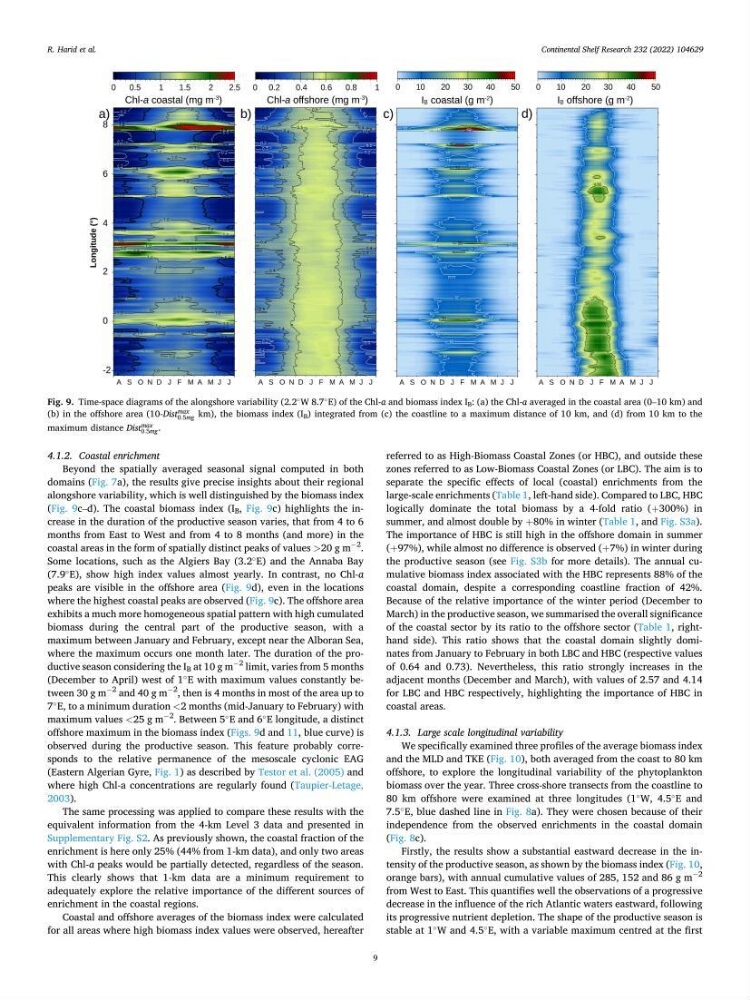
(Fig. 9c–d). The coastal biomass index (I B , Fig. 9c) highlights the increase in the duration of the productive season varies, that from 4 to 6
months from East to West and from 4 to 8 months (and more) in the
coastal areas in the form of spatially distinct peaks of values >20 g m
−2
.
Some locations, such as the Algiers Bay (3.2
◦
E) and the Annaba Bay
(7.9
◦
E), show high index values almost yearly. In contrast, no Chl-a
peaks are visible in the offshore area (Fig. 9d), even in the locations
where the highest coastal peaks are observed (Fig. 9c). The offshore area
exhibits a much more homogeneous spatial pattern with high cumulated
biomass during the central part of the productive season, with a
maximum between January and February, except near the Alboran Sea,
where the maximum occurs one month later. The duration of the productive season considering the I B at 10 g m
−2
limit, varies from 5 months
(December to April) west of 1
◦
E with maximum values constantly between 30 g m
−2
and 40 g m
−2
, then is 4 months in most of the area up to
7
◦
E, to a minimum duration <2 months (mid-January to February) with
maximum values <25 g m
−2
. Between 5
◦
E and 6
◦
E longitude, a distinct
offshore maximum in the biomass index (Figs. 9d and 11, blue curve) is
observed during the productive season. This feature probably corresponds to the relative permanence of the mesoscale cyclonic EAG
(Eastern Algerian Gyre, Fig. 1) as described by Testor et al. (2005) and
where high Chl-a concentrations are regularly found (Taupier-Letage,
2003).
The same processing was applied to compare these results with the
equivalent information from the 4-km Level 3 data and presented in
Supplementary Fig. S2. As previously shown, the coastal fraction of the
enrichment is here only 25% (44% from 1-km data), and only two areas
with Chl-a peaks would be partially detected, regardless of the season.
This clearly shows that 1-km data are a minimum requirement to
adequately explore the relative importance of the different sources of
enrichment in the coastal regions.
Coastal and offshore averages of the biomass index were calculated
for all areas where high biomass index values were observed, hereafter
referred to as High-Biomass Coastal Zones (or HBC), and outside these
zones referred to as Low-Biomass Coastal Zones (or LBC). The aim is to
separate the specific effects of local (coastal) enrichments from the
large-scale enrichments (Table 1, left-hand side). Compared to LBC, HBC
logically dominate the total biomass by a 4-fold ratio (+300%) in
summer, and almost double by +80% in winter (Table 1, and Fig. S3a).
The importance of HBC is still high in the offshore domain in summer
(+97%), while almost no difference is observed (+7%) in winter during
the productive season (see Fig. S3b for more details). The annual cumulative biomass index associated with the HBC represents 88% of the
coastal domain, despite a corresponding coastline fraction of 42%.
Because of the relative importance of the winter period (December to
March) in the productive season, we summarised the overall significance
of the coastal sector by its ratio to the offshore sector (Table 1, righthand side). This ratio shows that the coastal domain slightly dominates from January to February in both LBC and HBC (respective values
of 0.64 and 0.73). Nevertheless, this ratio strongly increases in the
adjacent months (December and March), with values of 2.57 and 4.14
for LBC and HBC respectively, highlighting the importance of HBC in
coastal areas.
4.1.3. Large scale longitudinal variability
We specifically examined three profiles of the average biomass index
and the MLD and TKE (Fig. 10), both averaged from the coast to 80 km
offshore, to explore the longitudinal variability of the phytoplankton
biomass over the year. Three cross-shore transects from the coastline to
80 km offshore were examined at three longitudes (1
◦
W, 4.5
◦
E and
7.5
◦
E, blue dashed line in Fig. 8a). They were chosen because of their
independence from the observed enrichments in the coastal domain
(Fig. 8c).
Firstly, the results show a substantial eastward decrease in the intensity of the productive season, as shown by the biomass index (Fig. 10,
orange bars), with annual cumulative values of 285, 152 and 86 g m
−2
from West to East. This quantifies well the observations of a progressive
decrease in the influence of the rich Atlantic waters eastward, following
its progressive nutrient depletion. The shape of the productive season is
stable at 1
◦
W and 4.5
◦
E, with a variable maximum centred at the first
Fig. 9. Time-space diagrams of the alongshore variability (2.2
◦
W 8.7
◦
E) of the Chl-a and biomass index I B : (a) the Chl-a averaged in the coastal area (0–10 km) and
(b) in the offshore area (10-Dist
max
0.5mg km), the biomass index (I B ) integrated from (c) the coastline to a maximum distance of 10 km, and (d) from 10 km to the
maximum distance Dist
max
0.5mg .
R. Harid et al.
9
4.1.2. Coastal enrichment
Beyond the spatially averaged seasonal signal computed in both
domains (Fig. 7a), the results give precise insights about their regional
alongshore variability, which is well distinguished by the biomass index
(Fig. 9c–d). The coastal biomass index (I B , Fig. 9c) highlights the increase in the duration of the productive season varies, that from 4 to 6
months from East to West and from 4 to 8 months (and more) in the
coastal areas in the form of spatially distinct peaks of values >20 g m
−2
.
Some locations, such as the Algiers Bay (3.2
◦
E) and the Annaba Bay
(7.9
◦
E), show high index values almost yearly. In contrast, no Chl-a
peaks are visible in the offshore area (Fig. 9d), even in the locations
where the highest coastal peaks are observed (Fig. 9c). The offshore area
exhibits a much more homogeneous spatial pattern with high cumulated
biomass during the central part of the productive season, with a
maximum between January and February, except near the Alboran Sea,
where the maximum occurs one month later. The duration of the productive season considering the I B at 10 g m
−2
limit, varies from 5 months
(December to April) west of 1
◦
E with maximum values constantly between 30 g m
−2
and 40 g m
−2
, then is 4 months in most of the area up to
7
◦
E, to a minimum duration <2 months (mid-January to February) with
maximum values <25 g m
−2
. Between 5
◦
E and 6
◦
E longitude, a distinct
offshore maximum in the biomass index (Figs. 9d and 11, blue curve) is
observed during the productive season. This feature probably corresponds to the relative permanence of the mesoscale cyclonic EAG
(Eastern Algerian Gyre, Fig. 1) as described by Testor et al. (2005) and
where high Chl-a concentrations are regularly found (Taupier-Letage,
2003).
The same processing was applied to compare these results with the
equivalent information from the 4-km Level 3 data and presented in
Supplementary Fig. S2. As previously shown, the coastal fraction of the
enrichment is here only 25% (44% from 1-km data), and only two areas
with Chl-a peaks would be partially detected, regardless of the season.
This clearly shows that 1-km data are a minimum requirement to
adequately explore the relative importance of the different sources of
enrichment in the coastal regions.
Coastal and offshore averages of the biomass index were calculated
for all areas where high biomass index values were observed, hereafter
referred to as High-Biomass Coastal Zones (or HBC), and outside these
zones referred to as Low-Biomass Coastal Zones (or LBC). The aim is to
separate the specific effects of local (coastal) enrichments from the
large-scale enrichments (Table 1, left-hand side). Compared to LBC, HBC
logically dominate the total biomass by a 4-fold ratio (+300%) in
summer, and almost double by +80% in winter (Table 1, and Fig. S3a).
The importance of HBC is still high in the offshore domain in summer
(+97%), while almost no difference is observed (+7%) in winter during
the productive season (see Fig. S3b for more details). The annual cumulative biomass index associated with the HBC represents 88% of the
coastal domain, despite a corresponding coastline fraction of 42%.
Because of the relative importance of the winter period (December to
March) in the productive season, we summarised the overall significance
of the coastal sector by its ratio to the offshore sector (Table 1, righthand side). This ratio shows that the coastal domain slightly dominates from January to February in both LBC and HBC (respective values
of 0.64 and 0.73). Nevertheless, this ratio strongly increases in the
adjacent months (December and March), with values of 2.57 and 4.14
for LBC and HBC respectively, highlighting the importance of HBC in
coastal areas.
4.1.3. Large scale longitudinal variability
We specifically examined three profiles of the average biomass index
and the MLD and TKE (Fig. 10), both averaged from the coast to 80 km
offshore, to explore the longitudinal variability of the phytoplankton
biomass over the year. Three cross-shore transects from the coastline to
80 km offshore were examined at three longitudes (1
◦
W, 4.5
◦
E and
7.5
◦
E, blue dashed line in Fig. 8a). They were chosen because of their
independence from the observed enrichments in the coastal domain
(Fig. 8c).
Firstly, the results show a substantial eastward decrease in the intensity of the productive season, as shown by the biomass index (Fig. 10,
orange bars), with annual cumulative values of 285, 152 and 86 g m
−2
from West to East. This quantifies well the observations of a progressive
decrease in the influence of the rich Atlantic waters eastward, following
its progressive nutrient depletion. The shape of the productive season is
stable at 1
◦
W and 4.5
◦
E, with a variable maximum centred at the first
Fig. 9. Time-space diagrams of the alongshore variability (2.2
◦
W 8.7
◦
E) of the Chl-a and biomass index I B : (a) the Chl-a averaged in the coastal area (0–10 km) and
(b) in the offshore area (10-Dist
max
0.5mg km), the biomass index (I B ) integrated from (c) the coastline to a maximum distance of 10 km, and (d) from 10 km to the
maximum distance Dist
max
0.5mg .
R. Harid et al.