

Continental Shelf Research 232 (2022) 104629
8
also been drawn more recently by several authors (Fani et al., 2014;
Huertas et al., 2012; Lazzari et al., 2012; Pasqueron de Fommervault
et al., 2015). Consequently, the eastward propagating eddies modulate
the circulation of water masses beyond the continental shelf (Pessini
et al., 2020), generating intense vertical mixing (Millot et al., 1990). Its
positive influence on productivity is perceptible up to the eastern part of
the country and is reinforced by nutrient enrichments from the bottom
(Millot et al., 1990). The offshore vertical mixing is considered to be the
main factor influencing winter-spring enrichments before the
summer-autumn stratification period.
In addition to these two well-known potential sources of enrichment,
we identified a third coastal source: the presence of nutrients of coastal
origin, generally associated with bays or gulfs, which enhance local
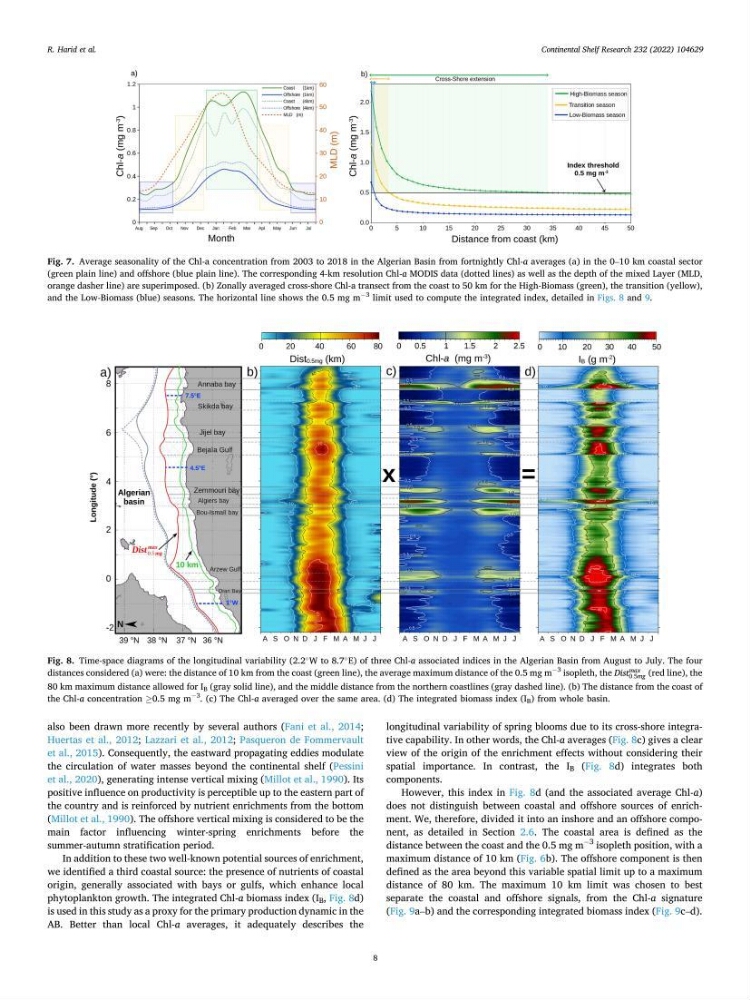
phytoplankton growth. The integrated Chl-a biomass index (I B , Fig. 8d)
is used in this study as a proxy for the primary production dynamic in the
AB. Better than local Chl-a averages, it adequately describes the
longitudinal variability of spring blooms due to its cross-shore integrative capability. In other words, the Chl-a averages (Fig. 8c) gives a clear
view of the origin of the enrichment effects without considering their
spatial importance. In contrast, the I B (Fig. 8d) integrates both
components.
However, this index in Fig. 8d (and the associated average Chl-a)
does not distinguish between coastal and offshore sources of enrichment. We, therefore, divided it into an inshore and an offshore component, as detailed in Section 2.6. The coastal area is defined as the
distance between the coast and the 0.5 mg m
−3
isopleth position, with a
maximum distance of 10 km (Fig. 6b). The offshore component is then
defined as the area beyond this variable spatial limit up to a maximum
distance of 80 km. The maximum 10 km limit was chosen to best
separate the coastal and offshore signals, from the Chl-a signature
(Fig. 9a–b) and the corresponding integrated biomass index (Fig. 9c–d).
Fig. 7. Average seasonality of the Chl-a concentration from 2003 to 2018 in the Algerian Basin from fortnightly Chl-a averages (a) in the 0–10 km coastal sector
(green plain line) and offshore (blue plain line). The corresponding 4-km resolution Chl-a MODIS data (dotted lines) as well as the depth of the mixed Layer (MLD,
orange dasher line) are superimposed. (b) Zonally averaged cross-shore Chl-a transect from the coast to 50 km for the High-Biomass (green), the transition (yellow),
and the Low-Biomass (blue) seasons. The horizontal line shows the 0.5 mg m
−3
limit used to compute the integrated index, detailed in Figs. 8 and 9.
Fig. 8. Time-space diagrams of the longitudinal variability (2.2
◦
W to 8.7
◦
E) of three Chl-a associated indices in the Algerian Basin from August to July. The four
distances considered (a) were: the distance of 10 km from the coast (green line), the average maximum distance of the 0.5 mg m
−3
isopleth, the Dist
max
0.5mg (red line), the
80 km maximum distance allowed for I B (gray solid line), and the middle distance from the northern coastlines (gray dashed line). (b) The distance from the coast of
the Chl-a concentration ≥0.5 mg m
−3
. (c) The Chl-a averaged over the same area. (d) The integrated biomass index (I B ) from whole basin.
R. Harid et al.
8
also been drawn more recently by several authors (Fani et al., 2014;
Huertas et al., 2012; Lazzari et al., 2012; Pasqueron de Fommervault
et al., 2015). Consequently, the eastward propagating eddies modulate
the circulation of water masses beyond the continental shelf (Pessini
et al., 2020), generating intense vertical mixing (Millot et al., 1990). Its
positive influence on productivity is perceptible up to the eastern part of
the country and is reinforced by nutrient enrichments from the bottom
(Millot et al., 1990). The offshore vertical mixing is considered to be the
main factor influencing winter-spring enrichments before the
summer-autumn stratification period.
In addition to these two well-known potential sources of enrichment,
we identified a third coastal source: the presence of nutrients of coastal
origin, generally associated with bays or gulfs, which enhance local
phytoplankton growth. The integrated Chl-a biomass index (I B , Fig. 8d)
is used in this study as a proxy for the primary production dynamic in the
AB. Better than local Chl-a averages, it adequately describes the
longitudinal variability of spring blooms due to its cross-shore integrative capability. In other words, the Chl-a averages (Fig. 8c) gives a clear
view of the origin of the enrichment effects without considering their
spatial importance. In contrast, the I B (Fig. 8d) integrates both
components.
However, this index in Fig. 8d (and the associated average Chl-a)
does not distinguish between coastal and offshore sources of enrichment. We, therefore, divided it into an inshore and an offshore component, as detailed in Section 2.6. The coastal area is defined as the
distance between the coast and the 0.5 mg m
−3
isopleth position, with a
maximum distance of 10 km (Fig. 6b). The offshore component is then
defined as the area beyond this variable spatial limit up to a maximum
distance of 80 km. The maximum 10 km limit was chosen to best
separate the coastal and offshore signals, from the Chl-a signature
(Fig. 9a–b) and the corresponding integrated biomass index (Fig. 9c–d).
Fig. 7. Average seasonality of the Chl-a concentration from 2003 to 2018 in the Algerian Basin from fortnightly Chl-a averages (a) in the 0–10 km coastal sector
(green plain line) and offshore (blue plain line). The corresponding 4-km resolution Chl-a MODIS data (dotted lines) as well as the depth of the mixed Layer (MLD,
orange dasher line) are superimposed. (b) Zonally averaged cross-shore Chl-a transect from the coast to 50 km for the High-Biomass (green), the transition (yellow),
and the Low-Biomass (blue) seasons. The horizontal line shows the 0.5 mg m
−3
limit used to compute the integrated index, detailed in Figs. 8 and 9.
Fig. 8. Time-space diagrams of the longitudinal variability (2.2
◦
W to 8.7
◦
E) of three Chl-a associated indices in the Algerian Basin from August to July. The four
distances considered (a) were: the distance of 10 km from the coast (green line), the average maximum distance of the 0.5 mg m
−3
isopleth, the Dist
max
0.5mg (red line), the
80 km maximum distance allowed for I B (gray solid line), and the middle distance from the northern coastlines (gray dashed line). (b) The distance from the coast of
the Chl-a concentration ≥0.5 mg m
−3
. (c) The Chl-a averaged over the same area. (d) The integrated biomass index (I B ) from whole basin.
R. Harid et al.