

Continental Shelf Research 232 (2022) 104629
7
4.1. Processes governing Chl-a variability in AB
4.1.1. Seasonal variability
AB is characterised by two contrasting seasons (Fig. 7a): an early 3.5month high-biomass season (mid-December to March) and a 4.5-month
low-biomass season (June to mid-October), characterised by intense
stratification. The two seasons are separated by quasi symmetrical and
sharp 2-month transition periods in spring and autumn (Fig. 7a). The
extreme precocity of the productive period (between October and
November), i.e. during a low sun elevation, clearly shows that light is
not the main limiting factor in the occurrence of winter blooms. The
seasonality of Chl-a is closely related to the dynamics of the Mixed Layer
Depth (MLD, Fig. 7a, brown line and Fig. S1 in supplementary material),
which is maximum (40 m–60 m) in winter between December and
February and very low (15 m) in summer from June to September.
It is well known that winter and spring blooms in the region are
almost exclusively driven by the nutrient input following autumn and
winter vertical mixing (Fani et al., 2014; Huertas et al., 2012; Lazzari
et al., 2012; Millot et al., 1990; Pasqueron de Fommervault et al., 2015),
as reflected by our biomass index (Fig. 8d). Moreover, the results show
that high Chl-a values dominate several well-defined coastal areas
outside the productive season, from April to November (Fig. 8c). On a
large scale, the variability of Chl-a concentration in the AB is known to
be driven by the inflow of nutrient-rich Atlantic waters that enter the
Alboran Sea through the Gibraltar strait (Taupier-Letage and Millot,
1988) and progress eastwards along the AB. The same conclusions have
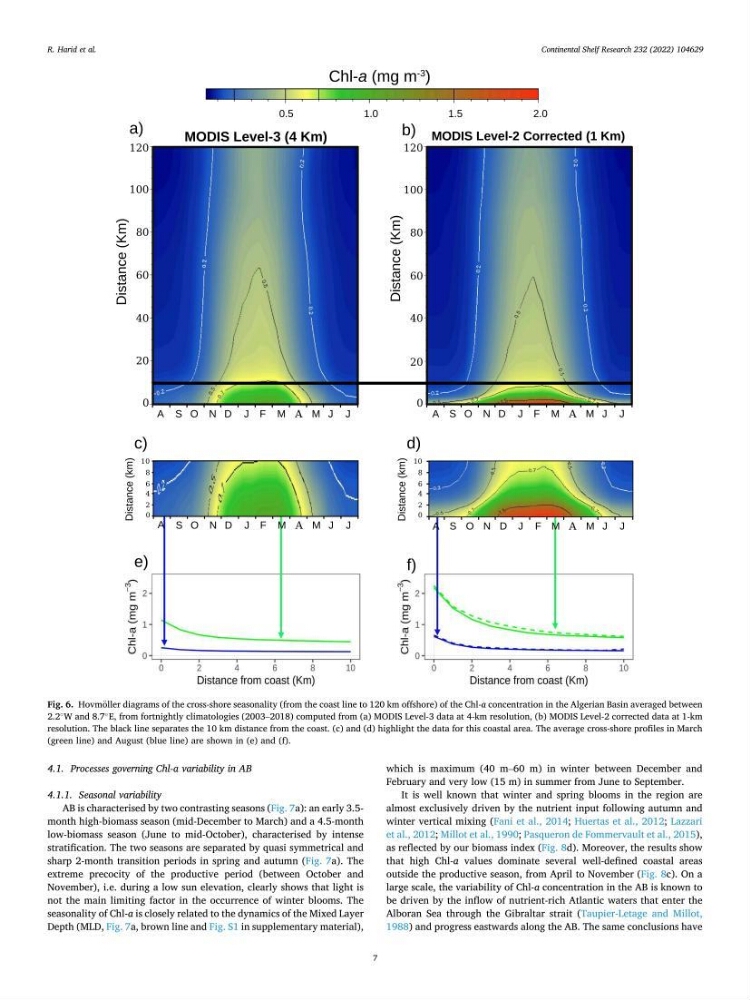
Fig. 6. Hovm¨ oller diagrams of the cross-shore seasonality (from the coast line to 120 km offshore) of the Chl-a concentration in the Algerian Basin averaged between
2.2
◦
W and 8.7
◦
E, from fortnightly climatologies (2003–2018) computed from (a) MODIS Level-3 data at 4-km resolution, (b) MODIS Level-2 corrected data at 1-km
resolution. The black line separates the 10 km distance from the coast. (c) and (d) highlight the data for this coastal area. The average cross-shore profiles in March
(green line) and August (blue line) are shown in (e) and (f).
R. Harid et al.
7
4.1. Processes governing Chl-a variability in AB
4.1.1. Seasonal variability
AB is characterised by two contrasting seasons (Fig. 7a): an early 3.5month high-biomass season (mid-December to March) and a 4.5-month
low-biomass season (June to mid-October), characterised by intense
stratification. The two seasons are separated by quasi symmetrical and
sharp 2-month transition periods in spring and autumn (Fig. 7a). The
extreme precocity of the productive period (between October and
November), i.e. during a low sun elevation, clearly shows that light is
not the main limiting factor in the occurrence of winter blooms. The
seasonality of Chl-a is closely related to the dynamics of the Mixed Layer
Depth (MLD, Fig. 7a, brown line and Fig. S1 in supplementary material),
which is maximum (40 m–60 m) in winter between December and
February and very low (15 m) in summer from June to September.
It is well known that winter and spring blooms in the region are
almost exclusively driven by the nutrient input following autumn and
winter vertical mixing (Fani et al., 2014; Huertas et al., 2012; Lazzari
et al., 2012; Millot et al., 1990; Pasqueron de Fommervault et al., 2015),
as reflected by our biomass index (Fig. 8d). Moreover, the results show
that high Chl-a values dominate several well-defined coastal areas
outside the productive season, from April to November (Fig. 8c). On a
large scale, the variability of Chl-a concentration in the AB is known to
be driven by the inflow of nutrient-rich Atlantic waters that enter the
Alboran Sea through the Gibraltar strait (Taupier-Letage and Millot,
1988) and progress eastwards along the AB. The same conclusions have
Fig. 6. Hovm¨ oller diagrams of the cross-shore seasonality (from the coast line to 120 km offshore) of the Chl-a concentration in the Algerian Basin averaged between
2.2
◦
W and 8.7
◦
E, from fortnightly climatologies (2003–2018) computed from (a) MODIS Level-3 data at 4-km resolution, (b) MODIS Level-2 corrected data at 1-km
resolution. The black line separates the 10 km distance from the coast. (c) and (d) highlight the data for this coastal area. The average cross-shore profiles in March
(green line) and August (blue line) are shown in (e) and (f).
R. Harid et al.