

Continental Shelf Research 232 (2022) 104629
3
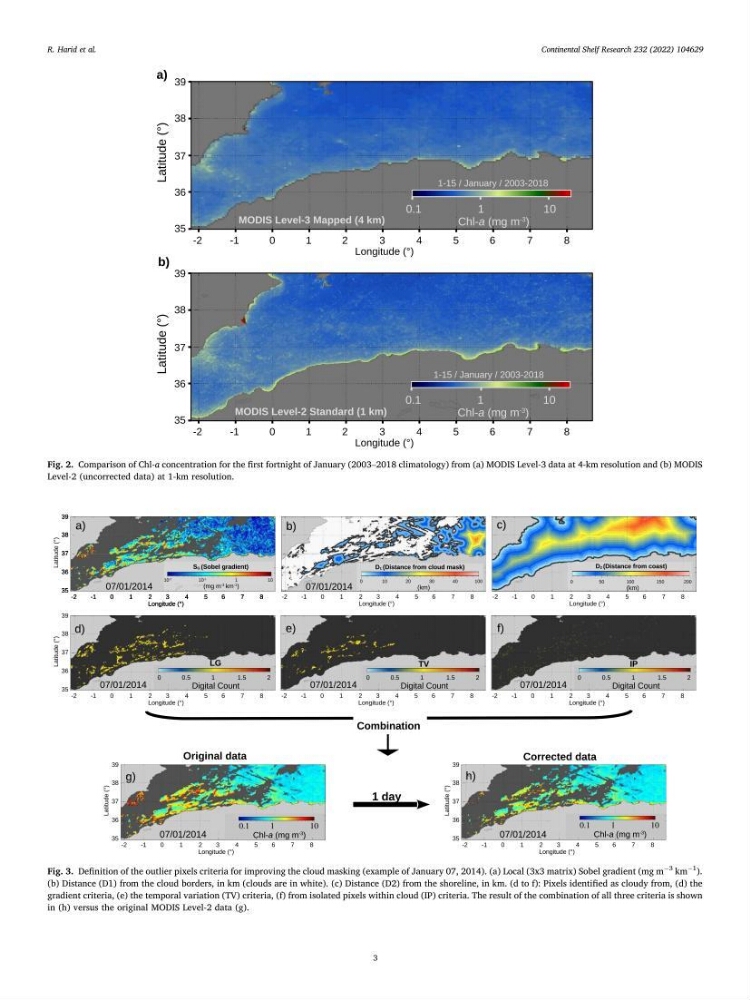
Fig. 2. Comparison of Chl-a concentration for the first fortnight of January (2003–2018 climatology) from (a) MODIS Level-3 data at 4-km resolution and (b) MODIS
Level-2 (uncorrected data) at 1-km resolution.
Fig. 3. Definition of the outlier pixels criteria for improving the cloud masking (example of January 07, 2014). (a) Local (3x3 matrix) Sobel gradient (mg m
−3
km
−1
).
(b) Distance (D1) from the cloud borders, in km (clouds are in white). (c) Distance (D2) from the shoreline, in km. (d to f): Pixels identified as cloudy from, (d) the
gradient criteria, (e) the temporal variation (TV) criteria, (f) from isolated pixels within cloud (IP) criteria. The result of the combination of all three criteria is shown
in (h) versus the original MODIS Level-2 data (g).
R. Harid et al.
3
Fig. 2. Comparison of Chl-a concentration for the first fortnight of January (2003–2018 climatology) from (a) MODIS Level-3 data at 4-km resolution and (b) MODIS
Level-2 (uncorrected data) at 1-km resolution.
Fig. 3. Definition of the outlier pixels criteria for improving the cloud masking (example of January 07, 2014). (a) Local (3x3 matrix) Sobel gradient (mg m
−3
km
−1
).
(b) Distance (D1) from the cloud borders, in km (clouds are in white). (c) Distance (D2) from the shoreline, in km. (d to f): Pixels identified as cloudy from, (d) the
gradient criteria, (e) the temporal variation (TV) criteria, (f) from isolated pixels within cloud (IP) criteria. The result of the combination of all three criteria is shown
in (h) versus the original MODIS Level-2 data (g).
R. Harid et al.