

Continental Shelf Research 232 (2022) 104629
2
Pacciaroni, 2009; Elbaz-Poulichet et al., 2001; Huertas et al., 2009),
with a direct influence on the Chl-a based phytoplanktonic biomass. In
winter, the presence of distinct water bodies indicates the eastward
movements of anticyclonic eddies (Olita et al., 2011), generated by instabilities in the Algerian current (Millot et al., 1990), which enrich the
surface water and increase its primary production. The Atlantic water
flow is characterised by a transit time of two to four months between
Gibraltar and the Algerian coasts (Millot, 1999), strongly influencing the
seasonal Chl-a signal (Salgado-Hernanz et al., 2019). In summer, the
stability of water masses limits the nutrient input (Moutin and Prieur,
2012), leading to a decrease in phytoplankton production.
The continental shelf of the AB is very narrow (15 km on average)
and is neglected in most studies. Nonetheless, the shelf is the richest
domain of the AB and shelter more complex interactions than in the
offshore domain. Ocean colour remote sensing has provided highquality observations in this respect for over twenty years on the abundance and distribution of Chl-a concentration, which is considered a
proxy for phytoplankton biomass (Cullen, 1982; Strickland, 1965).
Turbid waters in the Med are rare compared to other seas (Morel et
Prieur, 1977). According to Antoine et al. (1995), the coastal case-2
waters (where other constituents as mineral particles are also present)
in the whole Med are estimated to be 5%. Currently, ocean colour
analysis coupled with in-situ data could be used to characterise and
monitor phytoplankton blooms (Barale et al., 2008; Cerino et al., 2019;
Groom et al., 2019; Lavigne et al., 2015; Mayot et al., 2016; Palmi´ eri
et al., 2018). In previous studies, a significant limitation was related to
the poor representation of coastal patterns due to Level-3 data at 4-km
resolution (as in Lavigne et al. (2015); Mara˜ n´ on et al. (2020); Mayot
et al. (2016); Volpe (2012); Volpe et al. (2018)).
To this end, our study proposes a practical approach to improve the
quality of the standard MODIS-Aqua Level-2 1-km resolution (swatch)
Chl-a product, specifically in coastal environments, where the higher
data resolution provides more detailed information. A comparison between simultaneous in-situ and satellite Chl-a was performed to assess
the accuracy of MODIS Chl-a data in AB. In addition, a cumulative Chl-a
biomass index (I B ) was developed to synthesise the spatial patterns and
variability of Chl-a. This paper describes the seasonal climatology of I B
in AB from 16 years of data (2003–2018), focusing on offshore and
coastal areas separately. Finally, a discussion on the influence of
different sources of coastal enrichment on the Chl-a biomass in the AB is
presented.
2. Methods
2.1. Study area
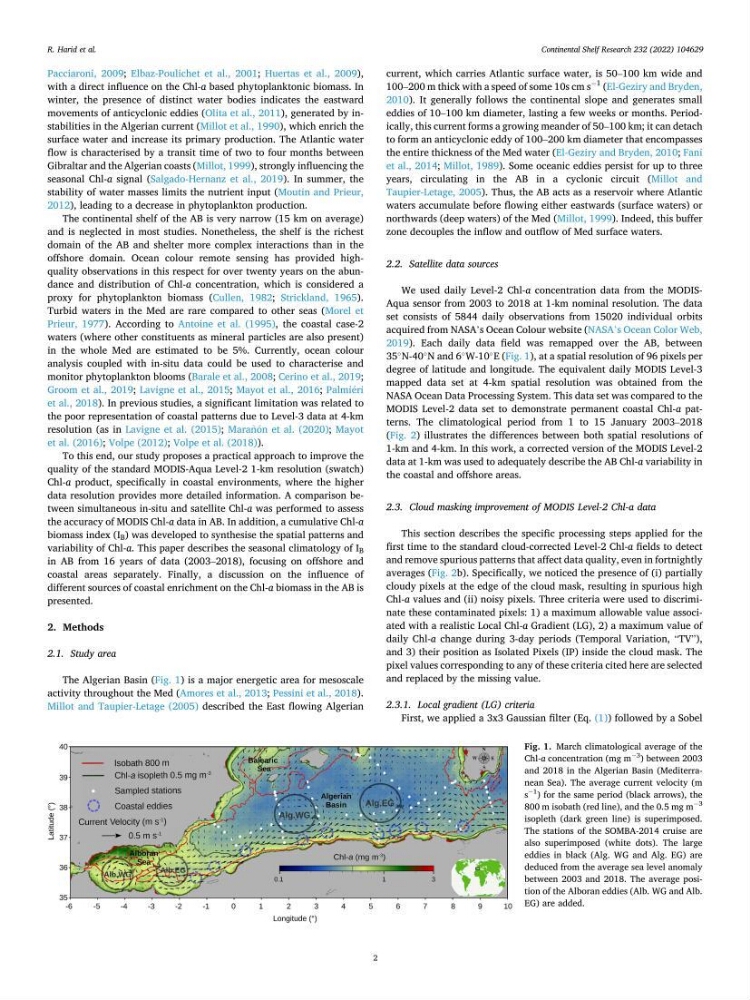
The Algerian Basin (Fig. 1) is a major energetic area for mesoscale
activity throughout the Med (Amores et al., 2013; Pessini et al., 2018).
Millot and Taupier-Letage (2005) described the East flowing Algerian
current, which carries Atlantic surface water, is 50–100 km wide and
100–200 m thick with a speed of some 10s cm s
−1
(El-Geziry and Bryden,
2010). It generally follows the continental slope and generates small
eddies of 10–100 km diameter, lasting a few weeks or months. Periodically, this current forms a growing meander of 50–100 km; it can detach
to form an anticyclonic eddy of 100–200 km diameter that encompasses
the entire thickness of the Med water (El-Geziry and Bryden, 2010; Fani
et al., 2014; Millot, 1989). Some oceanic eddies persist for up to three
years, circulating in the AB in a cyclonic circuit (Millot and
Taupier-Letage, 2005). Thus, the AB acts as a reservoir where Atlantic
waters accumulate before flowing either eastwards (surface waters) or
northwards (deep waters) of the Med (Millot, 1999). Indeed, this buffer
zone decouples the inflow and outflow of Med surface waters.
2.2. Satellite data sources
We used daily Level-2 Chl-a concentration data from the MODISAqua sensor from 2003 to 2018 at 1-km nominal resolution. The data
set consists of 5844 daily observations from 15020 individual orbits
acquired from NASA’s Ocean Colour website (NASA’s Ocean Color Web,
2019). Each daily data field was remapped over the AB, between
35
◦
N-40
◦
N and 6
◦
W-10
◦
E (Fig. 1), at a spatial resolution of 96 pixels per
degree of latitude and longitude. The equivalent daily MODIS Level-3
mapped data set at 4-km spatial resolution was obtained from the
NASA Ocean Data Processing System. This data set was compared to the
MODIS Level-2 data set to demonstrate permanent coastal Chl-a patterns. The climatological period from 1 to 15 January 2003–2018
(Fig. 2) illustrates the differences between both spatial resolutions of
1-km and 4-km. In this work, a corrected version of the MODIS Level-2
data at 1-km was used to adequately describe the AB Chl-a variability in
the coastal and offshore areas.
2.3. Cloud masking improvement of MODIS Level-2 Chl-a data
This section describes the specific processing steps applied for the
first time to the standard cloud-corrected Level-2 Chl-a fields to detect
and remove spurious patterns that affect data quality, even in fortnightly
averages (Fig. 2b). Specifically, we noticed the presence of (i) partially
cloudy pixels at the edge of the cloud mask, resulting in spurious high
Chl-a values and (ii) noisy pixels. Three criteria were used to discriminate these contaminated pixels: 1) a maximum allowable value associated with a realistic Local Chl-a Gradient (LG), 2) a maximum value of
daily Chl-a change during 3-day periods (Temporal Variation, “TV”),
and 3) their position as Isolated Pixels (IP) inside the cloud mask. The
pixel values corresponding to any of these criteria cited here are selected
and replaced by the missing value.
2.3.1. Local gradient (LG) criteria
First, we applied a 3x3 Gaussian filter (Eq. (1)) followed by a Sobel
Fig. 1. March climatological average of the
Chl-a concentration (mg m
−3
) between 2003
and 2018 in the Algerian Basin (Mediterranean Sea). The average current velocity (m
s
−1
) for the same period (black arrows), the
800 m isobath (red line), and the 0.5 mg m
−3
isopleth (dark green line) is superimposed.
The stations of the SOMBA-2014 cruise are
also superimposed (white dots). The large
eddies in black (Alg. WG and Alg. EG) are
deduced from the average sea level anomaly
between 2003 and 2018. The average position of the Alboran eddies (Alb. WG and Alb.
EG) are added.
R. Harid et al.
2
Pacciaroni, 2009; Elbaz-Poulichet et al., 2001; Huertas et al., 2009),
with a direct influence on the Chl-a based phytoplanktonic biomass. In
winter, the presence of distinct water bodies indicates the eastward
movements of anticyclonic eddies (Olita et al., 2011), generated by instabilities in the Algerian current (Millot et al., 1990), which enrich the
surface water and increase its primary production. The Atlantic water
flow is characterised by a transit time of two to four months between
Gibraltar and the Algerian coasts (Millot, 1999), strongly influencing the
seasonal Chl-a signal (Salgado-Hernanz et al., 2019). In summer, the
stability of water masses limits the nutrient input (Moutin and Prieur,
2012), leading to a decrease in phytoplankton production.
The continental shelf of the AB is very narrow (15 km on average)
and is neglected in most studies. Nonetheless, the shelf is the richest
domain of the AB and shelter more complex interactions than in the
offshore domain. Ocean colour remote sensing has provided highquality observations in this respect for over twenty years on the abundance and distribution of Chl-a concentration, which is considered a
proxy for phytoplankton biomass (Cullen, 1982; Strickland, 1965).
Turbid waters in the Med are rare compared to other seas (Morel et
Prieur, 1977). According to Antoine et al. (1995), the coastal case-2
waters (where other constituents as mineral particles are also present)
in the whole Med are estimated to be 5%. Currently, ocean colour
analysis coupled with in-situ data could be used to characterise and
monitor phytoplankton blooms (Barale et al., 2008; Cerino et al., 2019;
Groom et al., 2019; Lavigne et al., 2015; Mayot et al., 2016; Palmi´ eri
et al., 2018). In previous studies, a significant limitation was related to
the poor representation of coastal patterns due to Level-3 data at 4-km
resolution (as in Lavigne et al. (2015); Mara˜ n´ on et al. (2020); Mayot
et al. (2016); Volpe (2012); Volpe et al. (2018)).
To this end, our study proposes a practical approach to improve the
quality of the standard MODIS-Aqua Level-2 1-km resolution (swatch)
Chl-a product, specifically in coastal environments, where the higher
data resolution provides more detailed information. A comparison between simultaneous in-situ and satellite Chl-a was performed to assess
the accuracy of MODIS Chl-a data in AB. In addition, a cumulative Chl-a
biomass index (I B ) was developed to synthesise the spatial patterns and
variability of Chl-a. This paper describes the seasonal climatology of I B
in AB from 16 years of data (2003–2018), focusing on offshore and
coastal areas separately. Finally, a discussion on the influence of
different sources of coastal enrichment on the Chl-a biomass in the AB is
presented.
2. Methods
2.1. Study area
The Algerian Basin (Fig. 1) is a major energetic area for mesoscale
activity throughout the Med (Amores et al., 2013; Pessini et al., 2018).
Millot and Taupier-Letage (2005) described the East flowing Algerian
current, which carries Atlantic surface water, is 50–100 km wide and
100–200 m thick with a speed of some 10s cm s
−1
(El-Geziry and Bryden,
2010). It generally follows the continental slope and generates small
eddies of 10–100 km diameter, lasting a few weeks or months. Periodically, this current forms a growing meander of 50–100 km; it can detach
to form an anticyclonic eddy of 100–200 km diameter that encompasses
the entire thickness of the Med water (El-Geziry and Bryden, 2010; Fani
et al., 2014; Millot, 1989). Some oceanic eddies persist for up to three
years, circulating in the AB in a cyclonic circuit (Millot and
Taupier-Letage, 2005). Thus, the AB acts as a reservoir where Atlantic
waters accumulate before flowing either eastwards (surface waters) or
northwards (deep waters) of the Med (Millot, 1999). Indeed, this buffer
zone decouples the inflow and outflow of Med surface waters.
2.2. Satellite data sources
We used daily Level-2 Chl-a concentration data from the MODISAqua sensor from 2003 to 2018 at 1-km nominal resolution. The data
set consists of 5844 daily observations from 15020 individual orbits
acquired from NASA’s Ocean Colour website (NASA’s Ocean Color Web,
2019). Each daily data field was remapped over the AB, between
35
◦
N-40
◦
N and 6
◦
W-10
◦
E (Fig. 1), at a spatial resolution of 96 pixels per
degree of latitude and longitude. The equivalent daily MODIS Level-3
mapped data set at 4-km spatial resolution was obtained from the
NASA Ocean Data Processing System. This data set was compared to the
MODIS Level-2 data set to demonstrate permanent coastal Chl-a patterns. The climatological period from 1 to 15 January 2003–2018
(Fig. 2) illustrates the differences between both spatial resolutions of
1-km and 4-km. In this work, a corrected version of the MODIS Level-2
data at 1-km was used to adequately describe the AB Chl-a variability in
the coastal and offshore areas.
2.3. Cloud masking improvement of MODIS Level-2 Chl-a data
This section describes the specific processing steps applied for the
first time to the standard cloud-corrected Level-2 Chl-a fields to detect
and remove spurious patterns that affect data quality, even in fortnightly
averages (Fig. 2b). Specifically, we noticed the presence of (i) partially
cloudy pixels at the edge of the cloud mask, resulting in spurious high
Chl-a values and (ii) noisy pixels. Three criteria were used to discriminate these contaminated pixels: 1) a maximum allowable value associated with a realistic Local Chl-a Gradient (LG), 2) a maximum value of
daily Chl-a change during 3-day periods (Temporal Variation, “TV”),
and 3) their position as Isolated Pixels (IP) inside the cloud mask. The
pixel values corresponding to any of these criteria cited here are selected
and replaced by the missing value.
2.3.1. Local gradient (LG) criteria
First, we applied a 3x3 Gaussian filter (Eq. (1)) followed by a Sobel
Fig. 1. March climatological average of the
Chl-a concentration (mg m
−3
) between 2003
and 2018 in the Algerian Basin (Mediterranean Sea). The average current velocity (m
s
−1
) for the same period (black arrows), the
800 m isobath (red line), and the 0.5 mg m
−3
isopleth (dark green line) is superimposed.
The stations of the SOMBA-2014 cruise are
also superimposed (white dots). The large
eddies in black (Alg. WG and Alg. EG) are
deduced from the average sea level anomaly
between 2003 and 2018. The average position of the Alboran eddies (Alb. WG and Alb.
EG) are added.
R. Harid et al.