

Experimental Design and Quality Assurance
197
developed by Sivaprakasam et al. in 2003 for both NOM and bisphenol-A detection. It
employed a 266 nm microchip laser and narrow bandwidth of filters (7.5–14 nm) resulting
in an improved sensitivity limit to 0.005 ppb QS, rivaling benchtop spectrofluorometers.
Shown in Figure 6.6 are the 13 detection wavelengths overlaid on top of the emission spectrum of a discrete sample of NOM (Figure 6.6a) and changes in the NOM spectra for a
cruise tract from Tampa Bay, Florida out to Gulf of Mexico waters and returning to the bay
Porphyridium
Tryptophan
300
350
400
450
Gelbstoff
Raman
Dunaliella
Ex: 270
(a)
Porphyridium
Porphyridium
Gelbstoff
Chl a
450
500
550
600
650
600
650
Wavelength (nm)
700
700
Phycoerythrin
Phycoerythrin
Phycocyanin
Xantophyll
Raman
Dunaliella
Dunaliella
Ex: 420
(b)
Ex: 530
(c)
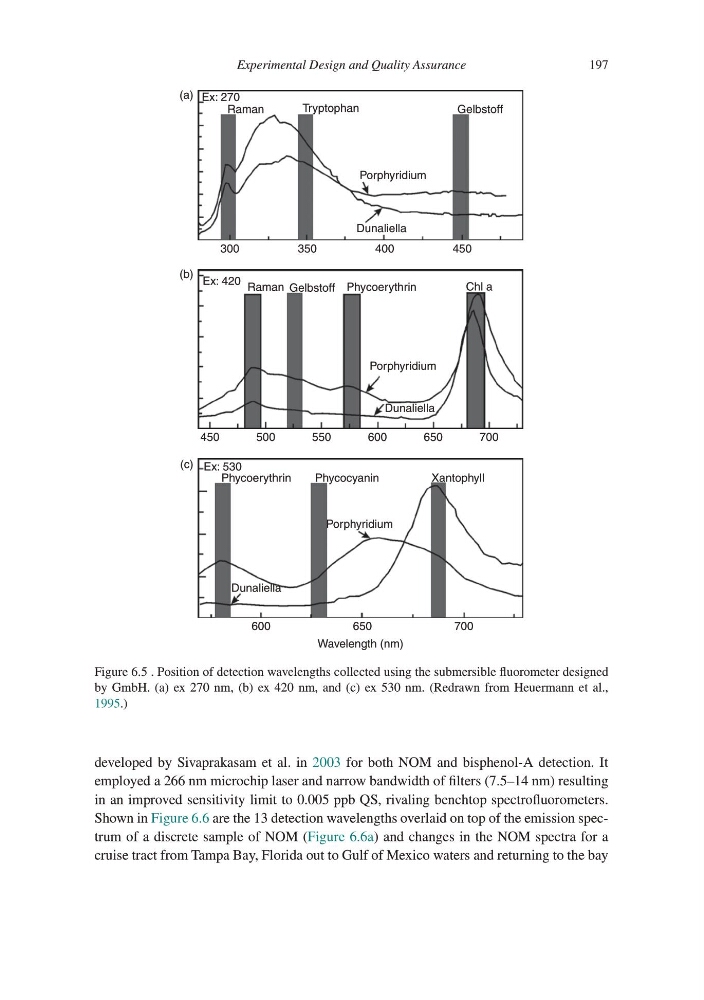
Figure 6.5 . Position of detection wavelengths collected using the submersible fluorometer designed
by GmbH. (a) ex 270 nm, (b) ex 420 nm, and (c) ex 530 nm. (Redrawn from Heuermann et al.,
1995.)
197
developed by Sivaprakasam et al. in 2003 for both NOM and bisphenol-A detection. It
employed a 266 nm microchip laser and narrow bandwidth of filters (7.5–14 nm) resulting
in an improved sensitivity limit to 0.005 ppb QS, rivaling benchtop spectrofluorometers.
Shown in Figure 6.6 are the 13 detection wavelengths overlaid on top of the emission spectrum of a discrete sample of NOM (Figure 6.6a) and changes in the NOM spectra for a
cruise tract from Tampa Bay, Florida out to Gulf of Mexico waters and returning to the bay
Porphyridium
Tryptophan
300
350
400
450
Gelbstoff
Raman
Dunaliella
Ex: 270
(a)
Porphyridium
Porphyridium
Gelbstoff
Chl a
450
500
550
600
650
600
650
Wavelength (nm)
700
700
Phycoerythrin
Phycoerythrin
Phycocyanin
Xantophyll
Raman
Dunaliella
Dunaliella
Ex: 420
(b)
Ex: 530
(c)
Figure 6.5 . Position of detection wavelengths collected using the submersible fluorometer designed
by GmbH. (a) ex 270 nm, (b) ex 420 nm, and (c) ex 530 nm. (Redrawn from Heuermann et al.,
1995.)