

Experimental Design and Quality Assurance
195
2
1 2 14 16
10
8
Hours
6
1 8 20 22 24 26
4
80
70
50
60
40
30
20
10
0
2
1 2 14 16
10
8
6
1 8 20 22 24 26
4
80
(a)
(b)
70
50
60
40
30
20
Fiber Optic Fluorometer
EM = 361 nm
Flow Through Fluorometer
EM = 360 nm
Concentration (ppb)
Concentration (ppb)
10
0
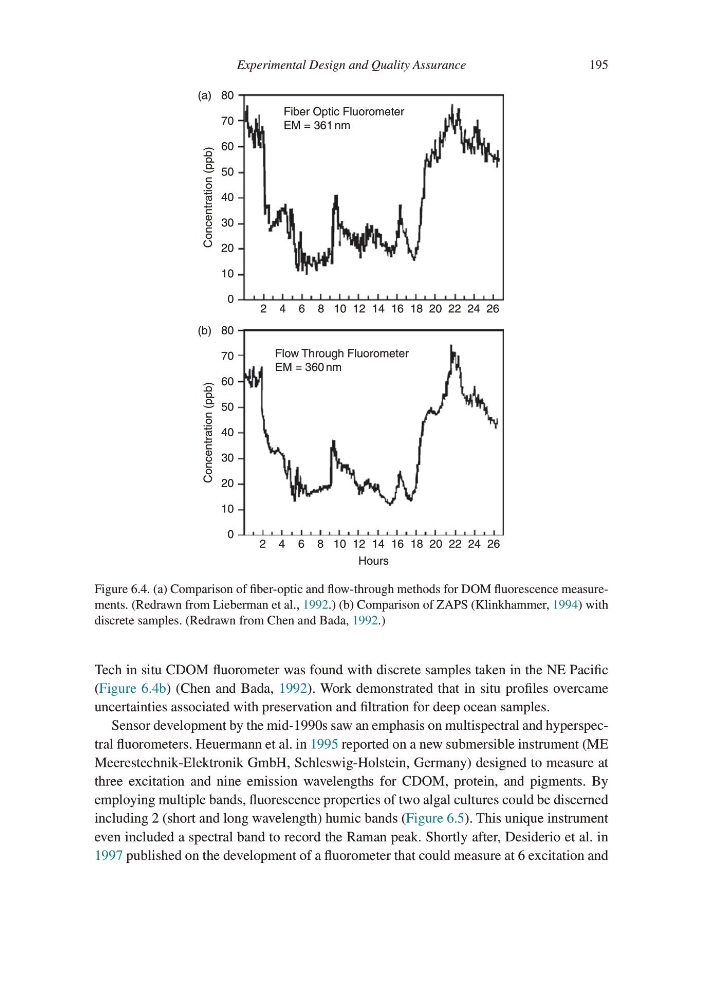
Figure 6.4. (a) Comparison of fiber-optic and flow-through methods for DOM fluorescence measurements. (Redrawn from Lieberman et al., 1992.) (b) Comparison of ZAPS (Klinkhammer, 1994) with
discrete samples. (Redrawn from Chen and Bada, 1992.)
Tech in situ CDOM fluorometer was found with discrete samples taken in the NE Pacific
(Figure 6.4b) (Chen and Bada, 1992). Work demonstrated that in situ profiles overcame
uncertainties associated with preservation and filtration for deep ocean samples.
Sensor development by the mid-1990s saw an emphasis on multispectral and hyperspectral fluorometers. Heuermann et al. in 1995 reported on a new submersible instrument (ME
Meerestechnik-Elektronik GmbH, Schleswig-Holstein, Germany) designed to measure at
three excitation and nine emission wavelengths for CDOM, protein, and pigments. By
employing multiple bands, fluorescence properties of two algal cultures could be discerned
including 2 (short and long wavelength) humic bands (Figure 6.5). This unique instrument
even included a spectral band to record the Raman peak. Shortly after, Desiderio et al. in
1997 published on the development of a fluorometer that could measure at 6 excitation and
195
2
1 2 14 16
10
8
Hours
6
1 8 20 22 24 26
4
80
70
50
60
40
30
20
10
0
2
1 2 14 16
10
8
6
1 8 20 22 24 26
4
80
(a)
(b)
70
50
60
40
30
20
Fiber Optic Fluorometer
EM = 361 nm
Flow Through Fluorometer
EM = 360 nm
Concentration (ppb)
Concentration (ppb)
10
0
Figure 6.4. (a) Comparison of fiber-optic and flow-through methods for DOM fluorescence measurements. (Redrawn from Lieberman et al., 1992.) (b) Comparison of ZAPS (Klinkhammer, 1994) with
discrete samples. (Redrawn from Chen and Bada, 1992.)
Tech in situ CDOM fluorometer was found with discrete samples taken in the NE Pacific
(Figure 6.4b) (Chen and Bada, 1992). Work demonstrated that in situ profiles overcame
uncertainties associated with preservation and filtration for deep ocean samples.
Sensor development by the mid-1990s saw an emphasis on multispectral and hyperspectral fluorometers. Heuermann et al. in 1995 reported on a new submersible instrument (ME
Meerestechnik-Elektronik GmbH, Schleswig-Holstein, Germany) designed to measure at
three excitation and nine emission wavelengths for CDOM, protein, and pigments. By
employing multiple bands, fluorescence properties of two algal cultures could be discerned
including 2 (short and long wavelength) humic bands (Figure 6.5). This unique instrument
even included a spectral band to record the Raman peak. Shortly after, Desiderio et al. in
1997 published on the development of a fluorometer that could measure at 6 excitation and