

Conmy, Del Castillo, Downing, and Chen
194
respectively. Meter output was in volts and was observed to be linear (using quinine sulfate
dihydrate [QS] standards) over a wide range of concentrations due to operator selection
among three gain settings. This sensor was tested and utilized by a number of researchers
(Chen and Bada, 1992; Coble et al., 1998; Chen, 1999; and others) and demonstrated that it
was a robust tool for tracking DOM optical properties in aquatic environments. The optical
design is still used today and is discussed later in this chapter.
The following years gave rise to a number of instrument design types for various applications. In 1992, Lieberman et al. developed a fiber optic–based system to measure petroleum hydrocarbons in the San Diego Bay. It utilized a pulsed N 2 laser source (ex = 337 nm),
measured fluorescence at 360 nm (50 nm bandpass), and possessed a sheath on the optic
probe to protect the sensor from seaweed and provide constant viewing volume. Strong
agreement was found between this design and flow-through measurements (Figure 6.4a),
but with the advantage of rapid response times of measurements to align CDOM fluorescence data with CTD measurements. Another fiber optic design was introduced by
Klinkhammer in 1994. The submersible profiling zero angle photon spectrometer (ZAPS)
probe offered the sensitivity of PMT detection and utilized a xenon flash lamp and the
versatility of fiber optics. It measured ex/em = 320/420 nm down to 6000 m. Data were
calibrated using QS standards at several temperatures. Good agreement between a Sea
0
0
8 0
60
40
CDOM
CHL*3
Flavin
Relative Fluorescence
20
50
100
150
Depth (m)
200
300
250
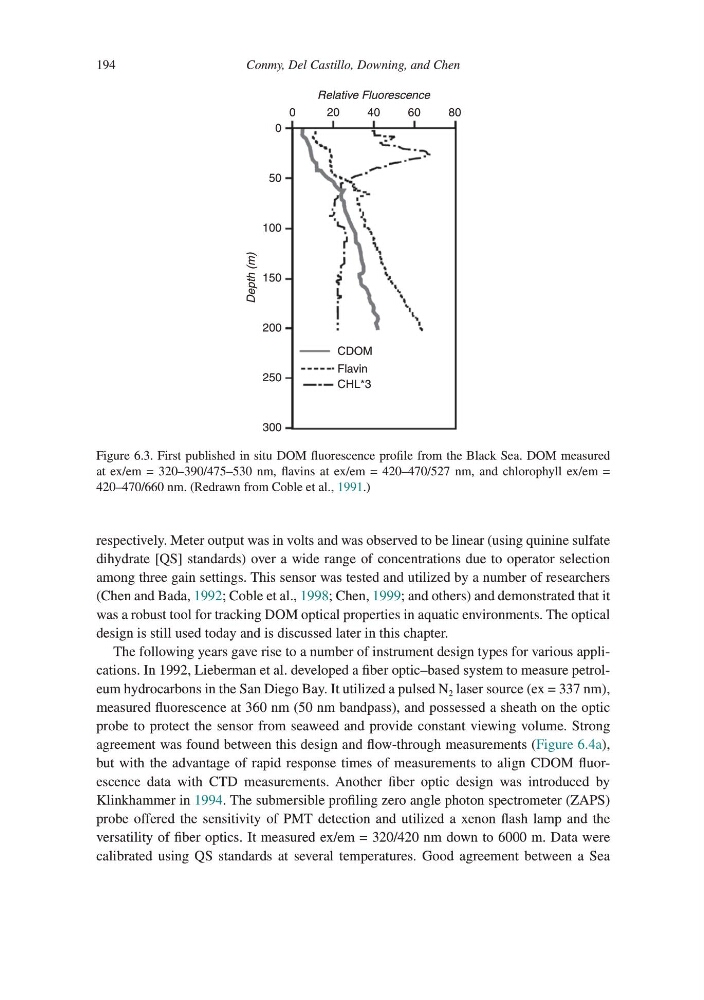
Figure 6.3. First published in situ DOM fluorescence profile from the Black Sea. DOM measured
at ex/em = 320–390/475–530 nm, flavins at ex/em = 420–470/527 nm, and chlorophyll ex/em =
420–470/660 nm. (Redrawn from Coble et al., 1991.)
194
respectively. Meter output was in volts and was observed to be linear (using quinine sulfate
dihydrate [QS] standards) over a wide range of concentrations due to operator selection
among three gain settings. This sensor was tested and utilized by a number of researchers
(Chen and Bada, 1992; Coble et al., 1998; Chen, 1999; and others) and demonstrated that it
was a robust tool for tracking DOM optical properties in aquatic environments. The optical
design is still used today and is discussed later in this chapter.
The following years gave rise to a number of instrument design types for various applications. In 1992, Lieberman et al. developed a fiber optic–based system to measure petroleum hydrocarbons in the San Diego Bay. It utilized a pulsed N 2 laser source (ex = 337 nm),
measured fluorescence at 360 nm (50 nm bandpass), and possessed a sheath on the optic
probe to protect the sensor from seaweed and provide constant viewing volume. Strong
agreement was found between this design and flow-through measurements (Figure 6.4a),
but with the advantage of rapid response times of measurements to align CDOM fluorescence data with CTD measurements. Another fiber optic design was introduced by
Klinkhammer in 1994. The submersible profiling zero angle photon spectrometer (ZAPS)
probe offered the sensitivity of PMT detection and utilized a xenon flash lamp and the
versatility of fiber optics. It measured ex/em = 320/420 nm down to 6000 m. Data were
calibrated using QS standards at several temperatures. Good agreement between a Sea
0
0
8 0
60
40
CDOM
CHL*3
Flavin
Relative Fluorescence
20
50
100
150
Depth (m)
200
300
250
Figure 6.3. First published in situ DOM fluorescence profile from the Black Sea. DOM measured
at ex/em = 320–390/475–530 nm, flavins at ex/em = 420–470/527 nm, and chlorophyll ex/em =
420–470/660 nm. (Redrawn from Coble et al., 1991.)