

92
W. Y. B. Chang
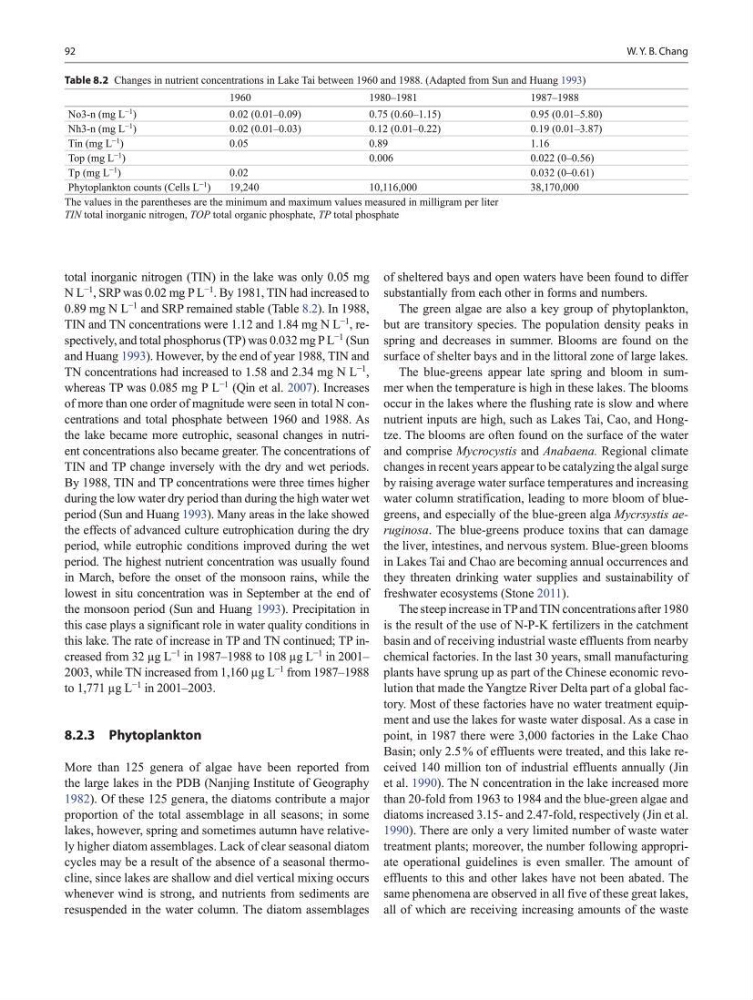
total inorganic nitrogen (TIN) in the lake was only 0.05 mg
N L
−1
, SRP was 0.02 mg P L
−1
. By 1981, TIN had increased to
0.89 mg N L
−1
and SRP remained stable (Table 8.2). In 1988,
TIN and TN concentrations were 1.12 and 1.84 mg N L
−1
, respectively, and total phosphorus (TP) was 0.032 mg P L
−1
(Sun
and Huang 1993). However, by the end of year 1988, TIN and
TN concentrations had increased to 1.58 and 2.34 mg N L
−1
,
whereas TP was 0.085 mg P L
−1
(Qin et al. 2007). Increases
of more than one order of magnitude were seen in total N concentrations and total phosphate between 1960 and 1988. As
the lake became more eutrophic, seasonal changes in nutrient concentrations also became greater. The concentrations of
TIN and TP change inversely with the dry and wet periods.
By 1988, TIN and TP concentrations were three times higher
during the low water dry period than during the high water wet
period (Sun and Huang 1993). Many areas in the lake showed
the effects of advanced culture eutrophication during the dry
period, while eutrophic conditions improved during the wet
period. The highest nutrient concentration was usually found
in March, before the onset of the monsoon rains, while the
lowest in situ concentration was in September at the end of
the monsoon period (Sun and Huang 1993). Precipitation in
this case plays a significant role in water quality conditions in
this lake. The rate of increase in TP and TN continued; TP increased from 32 µg L
−1
in 1987–1988 to 108 µg L
−1
in 2001–
2003, while TN increased from 1,160 µg L
−1
from 1987–1988
to 1,771 µg L
−1
in 2001–2003.
8.2.3 Phytoplankton
More than 125 genera of algae have been reported from
the large lakes in the PDB (Nanjing Institute of Geography
1982). Of these 125 genera, the diatoms contribute a major
proportion of the total assemblage in all seasons; in some
lakes, however, spring and sometimes autumn have relatively higher diatom assemblages. Lack of clear seasonal diatom
cycles may be a result of the absence of a seasonal thermocline, since lakes are shallow and diel vertical mixing occurs
whenever wind is strong, and nutrients from sediments are
resuspended in the water column. The diatom assemblages
of sheltered bays and open waters have been found to differ
substantially from each other in forms and numbers.
The green algae are also a key group of phytoplankton,
but are transitory species. The population density peaks in
spring and decreases in summer. Blooms are found on the
surface of shelter bays and in the littoral zone of large lakes.
The blue-greens appear late spring and bloom in summer when the temperature is high in these lakes. The blooms
occur in the lakes where the flushing rate is slow and where
nutrient inputs are high, such as Lakes Tai, Cao, and Hongtze. The blooms are often found on the surface of the water
and comprise Mycrocystis and Anabaena. Regional climate
changes in recent years appear to be catalyzing the algal surge
by raising average water surface temperatures and increasing
water column stratification, leading to more bloom of bluegreens, and especially of the blue-green alga Mycrsystis aeruginosa. The blue-greens produce toxins that can damage
the liver, intestines, and nervous system. Blue-green blooms
in Lakes Tai and Chao are becoming annual occurrences and
they threaten drinking water supplies and sustainability of
freshwater ecosystems (Stone 2011).
The steep increase in TP and TIN concentrations after 1980
is the result of the use of N-P-K fertilizers in the catchment
basin and of receiving industrial waste effluents from nearby
chemical factories. In the last 30 years, small manufacturing
plants have sprung up as part of the Chinese economic revolution that made the Yangtze River Delta part of a global factory. Most of these factories have no water treatment equipment and use the lakes for waste water disposal. As a case in
point, in 1987 there were 3,000 factories in the Lake Chao
Basin; only 2.5 % of effluents were treated, and this lake received 140 million ton of industrial effluents annually (Jin
et al. 1990). The N concentration in the lake increased more
than 20-fold from 1963 to 1984 and the blue-green algae and
diatoms increased 3.15- and 2.47-fold, respectively (Jin et al.
1990). There are only a very limited number of waste water
treatment plants; moreover, the number following appropriate operational guidelines is even smaller. The amount of
effluents to this and other lakes have not been abated. The
same phenomena are observed in all five of these great lakes,
all of which are receiving increasing amounts of the waste
Table 8.2 Changes in nutrient concentrations in Lake Tai between 1960 and 1988. (Adapted from Sun and Huang 1993)
1960
1980–1981
1987–1988
No3-n (mg L
−1
)
0.02 (0.01–0.09)
0.75 (0.60–1.15)
0.95 (0.01–5.80)
Nh3-n (mg L −1 )
0.02 (0.01–0.03)
0.12 (0.01–0.22)
0.19 (0.01–3.87)
Tin (mg L −1 )
0.05
0.89
1.16
Top (mg L −1 )
0.006
0.022 (0–0.56)
Tp (mg L −1 )
0.02
0.032 (0–0.61)
Phytoplankton counts (Cells L −1 )
19,240
10,116,000
38,170,000
The values in the parentheses are the minimum and maximum values measured in milligram per liter
TIN total inorganic nitrogen, TOP total organic phosphate, TP total phosphate
W. Y. B. Chang
total inorganic nitrogen (TIN) in the lake was only 0.05 mg
N L
−1
, SRP was 0.02 mg P L
−1
. By 1981, TIN had increased to
0.89 mg N L
−1
and SRP remained stable (Table 8.2). In 1988,
TIN and TN concentrations were 1.12 and 1.84 mg N L
−1
, respectively, and total phosphorus (TP) was 0.032 mg P L
−1
(Sun
and Huang 1993). However, by the end of year 1988, TIN and
TN concentrations had increased to 1.58 and 2.34 mg N L
−1
,
whereas TP was 0.085 mg P L
−1
(Qin et al. 2007). Increases
of more than one order of magnitude were seen in total N concentrations and total phosphate between 1960 and 1988. As
the lake became more eutrophic, seasonal changes in nutrient concentrations also became greater. The concentrations of
TIN and TP change inversely with the dry and wet periods.
By 1988, TIN and TP concentrations were three times higher
during the low water dry period than during the high water wet
period (Sun and Huang 1993). Many areas in the lake showed
the effects of advanced culture eutrophication during the dry
period, while eutrophic conditions improved during the wet
period. The highest nutrient concentration was usually found
in March, before the onset of the monsoon rains, while the
lowest in situ concentration was in September at the end of
the monsoon period (Sun and Huang 1993). Precipitation in
this case plays a significant role in water quality conditions in
this lake. The rate of increase in TP and TN continued; TP increased from 32 µg L
−1
in 1987–1988 to 108 µg L
−1
in 2001–
2003, while TN increased from 1,160 µg L
−1
from 1987–1988
to 1,771 µg L
−1
in 2001–2003.
8.2.3 Phytoplankton
More than 125 genera of algae have been reported from
the large lakes in the PDB (Nanjing Institute of Geography
1982). Of these 125 genera, the diatoms contribute a major
proportion of the total assemblage in all seasons; in some
lakes, however, spring and sometimes autumn have relatively higher diatom assemblages. Lack of clear seasonal diatom
cycles may be a result of the absence of a seasonal thermocline, since lakes are shallow and diel vertical mixing occurs
whenever wind is strong, and nutrients from sediments are
resuspended in the water column. The diatom assemblages
of sheltered bays and open waters have been found to differ
substantially from each other in forms and numbers.
The green algae are also a key group of phytoplankton,
but are transitory species. The population density peaks in
spring and decreases in summer. Blooms are found on the
surface of shelter bays and in the littoral zone of large lakes.
The blue-greens appear late spring and bloom in summer when the temperature is high in these lakes. The blooms
occur in the lakes where the flushing rate is slow and where
nutrient inputs are high, such as Lakes Tai, Cao, and Hongtze. The blooms are often found on the surface of the water
and comprise Mycrocystis and Anabaena. Regional climate
changes in recent years appear to be catalyzing the algal surge
by raising average water surface temperatures and increasing
water column stratification, leading to more bloom of bluegreens, and especially of the blue-green alga Mycrsystis aeruginosa. The blue-greens produce toxins that can damage
the liver, intestines, and nervous system. Blue-green blooms
in Lakes Tai and Chao are becoming annual occurrences and
they threaten drinking water supplies and sustainability of
freshwater ecosystems (Stone 2011).
The steep increase in TP and TIN concentrations after 1980
is the result of the use of N-P-K fertilizers in the catchment
basin and of receiving industrial waste effluents from nearby
chemical factories. In the last 30 years, small manufacturing
plants have sprung up as part of the Chinese economic revolution that made the Yangtze River Delta part of a global factory. Most of these factories have no water treatment equipment and use the lakes for waste water disposal. As a case in
point, in 1987 there were 3,000 factories in the Lake Chao
Basin; only 2.5 % of effluents were treated, and this lake received 140 million ton of industrial effluents annually (Jin
et al. 1990). The N concentration in the lake increased more
than 20-fold from 1963 to 1984 and the blue-green algae and
diatoms increased 3.15- and 2.47-fold, respectively (Jin et al.
1990). There are only a very limited number of waste water
treatment plants; moreover, the number following appropriate operational guidelines is even smaller. The amount of
effluents to this and other lakes have not been abated. The
same phenomena are observed in all five of these great lakes,
all of which are receiving increasing amounts of the waste
Table 8.2 Changes in nutrient concentrations in Lake Tai between 1960 and 1988. (Adapted from Sun and Huang 1993)
1960
1980–1981
1987–1988
No3-n (mg L
−1
)
0.02 (0.01–0.09)
0.75 (0.60–1.15)
0.95 (0.01–5.80)
Nh3-n (mg L −1 )
0.02 (0.01–0.03)
0.12 (0.01–0.22)
0.19 (0.01–3.87)
Tin (mg L −1 )
0.05
0.89
1.16
Top (mg L −1 )
0.006
0.022 (0–0.56)
Tp (mg L −1 )
0.02
0.032 (0–0.61)
Phytoplankton counts (Cells L −1 )
19,240
10,116,000
38,170,000
The values in the parentheses are the minimum and maximum values measured in milligram per liter
TIN total inorganic nitrogen, TOP total organic phosphate, TP total phosphate