

93
8 Eutrophication in the Great Lakes of the Chinese Pacific Drainage Basin: Changes, Trends, and Management
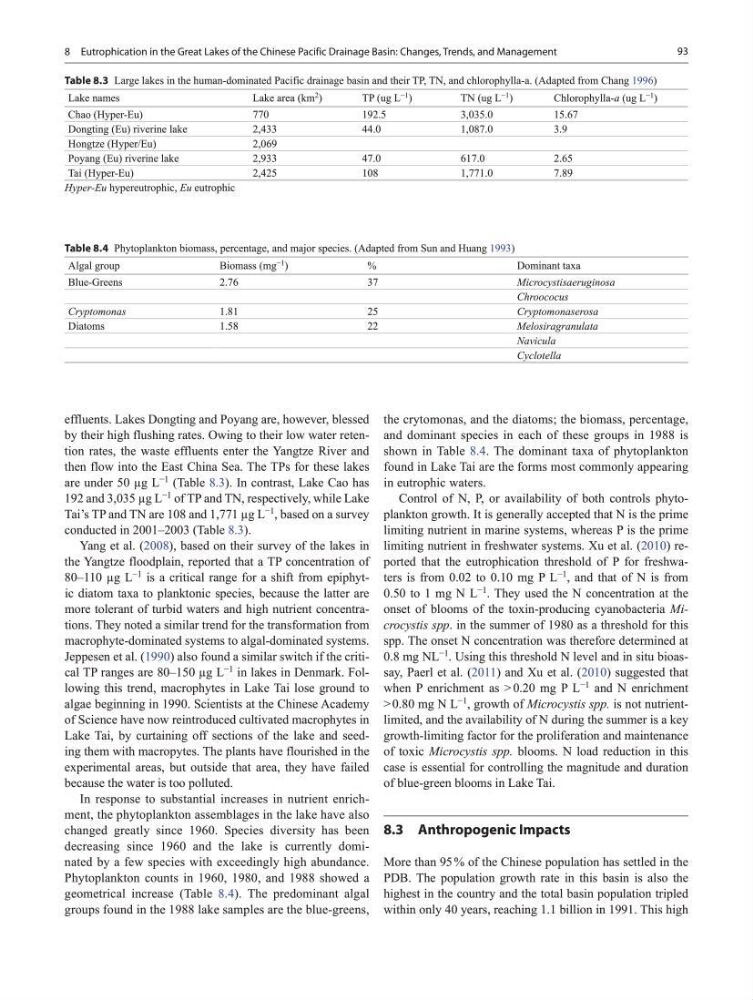
effluents. Lakes Dongting and Poyang are, however, blessed
by their high flushing rates. Owing to their low water retention rates, the waste effluents enter the Yangtze River and
then flow into the East China Sea. The TPs for these lakes
are under 50 µg L
−1
(Table 8.3). In contrast, Lake Cao has
192 and 3,035 µg L
−1
of TP and TN, respectively, while Lake
Tai’s TP and TN are 108 and 1,771 µg L
−1
, based on a survey
conducted in 2001–2003 (Table 8.3).
Yang et al. (2008), based on their survey of the lakes in
the Yangtze floodplain, reported that a TP concentration of
80–110 µg L
−1
is a critical range for a shift from epiphytic diatom taxa to planktonic species, because the latter are
more tolerant of turbid waters and high nutrient concentrations. They noted a similar trend for the transformation from
macrophyte-dominated systems to algal-dominated systems.
Jeppesen et al. (1990) also found a similar switch if the critical TP ranges are 80–150 µg L
−1
in lakes in Denmark. Following this trend, macrophytes in Lake Tai lose ground to
algae beginning in 1990. Scientists at the Chinese Academy
of Science have now reintroduced cultivated macrophytes in
Lake Tai, by curtaining off sections of the lake and seeding them with macropytes. The plants have flourished in the
experimental areas, but outside that area, they have failed
because the water is too polluted.
In response to substantial increases in nutrient enrichment, the phytoplankton assemblages in the lake have also
changed greatly since 1960. Species diversity has been
decreasing since 1960 and the lake is currently dominated by a few species with exceedingly high abundance.
Phytoplankton counts in 1960, 1980, and 1988 showed a
geometrical increase (Table 8.4). The predominant algal
groups found in the 1988 lake samples are the blue-greens,
the crytomonas, and the diatoms; the biomass, percentage,
and dominant species in each of these groups in 1988 is
shown in Table 8.4. The dominant taxa of phytoplankton
found in Lake Tai are the forms most commonly appearing
in eutrophic waters.
Control of N, P, or availability of both controls phytoplankton growth. It is generally accepted that N is the prime
limiting nutrient in marine systems, whereas P is the prime
limiting nutrient in freshwater systems. Xu et al. (2010) reported that the eutrophication threshold of P for freshwaters is from 0.02 to 0.10 mg P L
−1
, and that of N is from
0.50 to 1 mg N L
−1
. They used the N concentration at the
onset of blooms of the toxin-producing cyanobacteria Microcystis spp. in the summer of 1980 as a threshold for this
spp. The onset N concentration was therefore determined at
0.8 mg NL
−1
. Using this threshold N level and in situ bioassay, Paerl et al. (2011) and Xu et al. (2010) suggested that
when P enrichment as > 0.20 mg P L
−1
and N enrichment
> 0.80 mg N L
−1
, growth of Microcystis spp. is not nutrientlimited, and the availability of N during the summer is a key
growth-limiting factor for the proliferation and maintenance
of toxic Microcystis spp. blooms. N load reduction in this
case is essential for controlling the magnitude and duration
of blue-green blooms in Lake Tai.
8.3 Anthropogenic Impacts
More than 95 % of the Chinese population has settled in the
PDB. The population growth rate in this basin is also the
highest in the country and the total basin population tripled
within only 40 years, reaching 1.1 billion in 1991. This high
Table 8.3 Large lakes in the human-dominated Pacific drainage basin and their TP, TN, and chlorophylla-a. (Adapted from Chang 1996)
Lake names
Lake area (km 2 )
TP (ug L
−1
)
TN (ug L
−1
)
Chlorophylla-a (ug L
−1
)
Chao (Hyper-Eu)
770
192.5
3,035.0
15.67
Dongting (Eu) riverine lake
2,433
44.0
1,087.0
3.9
Hongtze (Hyper/Eu)
2,069
Poyang (Eu) riverine lake
2,933
47.0
617.0
2.65
Tai (Hyper-Eu)
2,425
108
1,771.0
7.89
Hyper-Eu hypereutrophic, Eu eutrophic
Table 8.4 Phytoplankton biomass, percentage, and major species. (Adapted from Sun and Huang 1993)
Algal group
Biomass (mg −1 )
%
Dominant taxa
Blue-Greens
2.76
37
Microcystisaeruginosa
Chroococus
Cryptomonas
1.81
25
Cryptomonaserosa
Diatoms
1.58
22
Melosiragranulata
Navicula
Cyclotella
8 Eutrophication in the Great Lakes of the Chinese Pacific Drainage Basin: Changes, Trends, and Management
effluents. Lakes Dongting and Poyang are, however, blessed
by their high flushing rates. Owing to their low water retention rates, the waste effluents enter the Yangtze River and
then flow into the East China Sea. The TPs for these lakes
are under 50 µg L
−1
(Table 8.3). In contrast, Lake Cao has
192 and 3,035 µg L
−1
of TP and TN, respectively, while Lake
Tai’s TP and TN are 108 and 1,771 µg L
−1
, based on a survey
conducted in 2001–2003 (Table 8.3).
Yang et al. (2008), based on their survey of the lakes in
the Yangtze floodplain, reported that a TP concentration of
80–110 µg L
−1
is a critical range for a shift from epiphytic diatom taxa to planktonic species, because the latter are
more tolerant of turbid waters and high nutrient concentrations. They noted a similar trend for the transformation from
macrophyte-dominated systems to algal-dominated systems.
Jeppesen et al. (1990) also found a similar switch if the critical TP ranges are 80–150 µg L
−1
in lakes in Denmark. Following this trend, macrophytes in Lake Tai lose ground to
algae beginning in 1990. Scientists at the Chinese Academy
of Science have now reintroduced cultivated macrophytes in
Lake Tai, by curtaining off sections of the lake and seeding them with macropytes. The plants have flourished in the
experimental areas, but outside that area, they have failed
because the water is too polluted.
In response to substantial increases in nutrient enrichment, the phytoplankton assemblages in the lake have also
changed greatly since 1960. Species diversity has been
decreasing since 1960 and the lake is currently dominated by a few species with exceedingly high abundance.
Phytoplankton counts in 1960, 1980, and 1988 showed a
geometrical increase (Table 8.4). The predominant algal
groups found in the 1988 lake samples are the blue-greens,
the crytomonas, and the diatoms; the biomass, percentage,
and dominant species in each of these groups in 1988 is
shown in Table 8.4. The dominant taxa of phytoplankton
found in Lake Tai are the forms most commonly appearing
in eutrophic waters.
Control of N, P, or availability of both controls phytoplankton growth. It is generally accepted that N is the prime
limiting nutrient in marine systems, whereas P is the prime
limiting nutrient in freshwater systems. Xu et al. (2010) reported that the eutrophication threshold of P for freshwaters is from 0.02 to 0.10 mg P L
−1
, and that of N is from
0.50 to 1 mg N L
−1
. They used the N concentration at the
onset of blooms of the toxin-producing cyanobacteria Microcystis spp. in the summer of 1980 as a threshold for this
spp. The onset N concentration was therefore determined at
0.8 mg NL
−1
. Using this threshold N level and in situ bioassay, Paerl et al. (2011) and Xu et al. (2010) suggested that
when P enrichment as > 0.20 mg P L
−1
and N enrichment
> 0.80 mg N L
−1
, growth of Microcystis spp. is not nutrientlimited, and the availability of N during the summer is a key
growth-limiting factor for the proliferation and maintenance
of toxic Microcystis spp. blooms. N load reduction in this
case is essential for controlling the magnitude and duration
of blue-green blooms in Lake Tai.
8.3 Anthropogenic Impacts
More than 95 % of the Chinese population has settled in the
PDB. The population growth rate in this basin is also the
highest in the country and the total basin population tripled
within only 40 years, reaching 1.1 billion in 1991. This high
Table 8.3 Large lakes in the human-dominated Pacific drainage basin and their TP, TN, and chlorophylla-a. (Adapted from Chang 1996)
Lake names
Lake area (km 2 )
TP (ug L
−1
)
TN (ug L
−1
)
Chlorophylla-a (ug L
−1
)
Chao (Hyper-Eu)
770
192.5
3,035.0
15.67
Dongting (Eu) riverine lake
2,433
44.0
1,087.0
3.9
Hongtze (Hyper/Eu)
2,069
Poyang (Eu) riverine lake
2,933
47.0
617.0
2.65
Tai (Hyper-Eu)
2,425
108
1,771.0
7.89
Hyper-Eu hypereutrophic, Eu eutrophic
Table 8.4 Phytoplankton biomass, percentage, and major species. (Adapted from Sun and Huang 1993)
Algal group
Biomass (mg −1 )
%
Dominant taxa
Blue-Greens
2.76
37
Microcystisaeruginosa
Chroococus
Cryptomonas
1.81
25
Cryptomonaserosa
Diatoms
1.58
22
Melosiragranulata
Navicula
Cyclotella