

257
18 Ultraviolet Radiation and Bromide as Limiting Factors in Eutrophication Processes in Semiarid Climate Zones
18.3.2.3 BOD 5
The BOD 5 concentrations in all samples for 2006, 2007,
2008, 2009, and 2010 were less than 10 mg/l.
18.3.2.4 COD
The COD concentrations in all seasons were less than
20 mg/l except in the winter 2007 and winter 2008 when
values were more than 20 mg/l, but less than 30 mg/l.
18.3.2.5 TOC
The TOC concentrations in all samples were less than 2 mg/l.
18.3.2.6 Chlorophyll a and Plankton Count
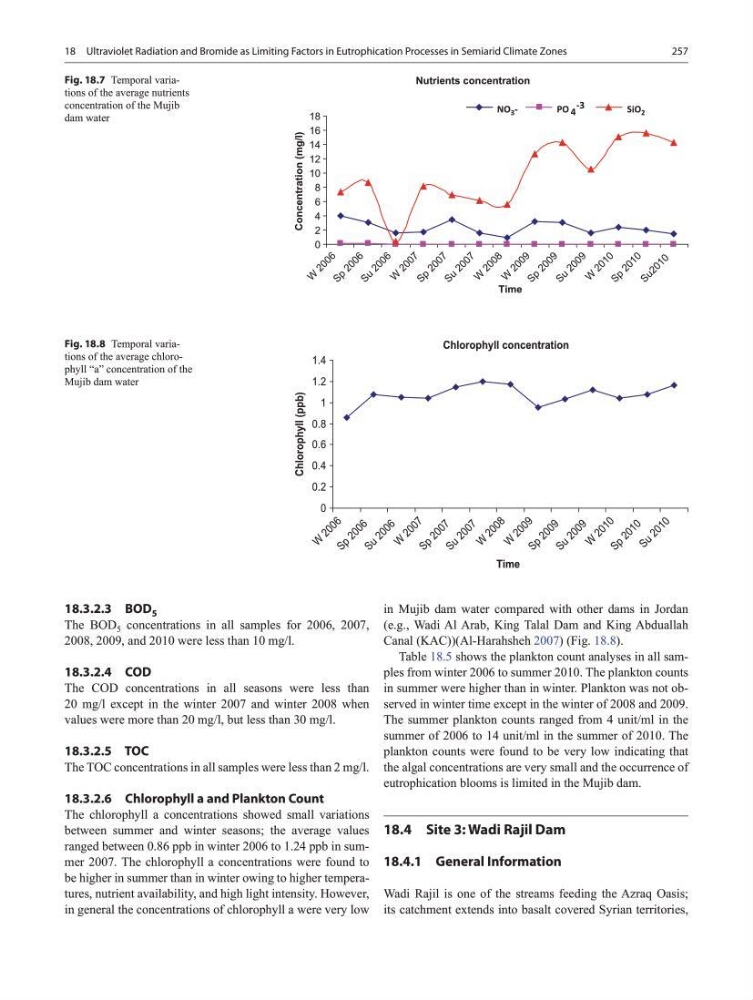
The chlorophyll a concentrations showed small variations
between summer and winter seasons; the average values
ranged between 0.86 ppb in winter 2006 to 1.24 ppb in summer 2007. The chlorophyll a concentrations were found to
be higher in summer than in winter owing to higher temperatures, nutrient availability, and high light intensity. However,
in general the concentrations of chlorophyll a were very low
in Mujib dam water compared with other dams in Jordan
(e.g., Wadi Al Arab, King Talal Dam and King Abduallah
Canal (KAC))(Al-Harahsheh 2007) (Fig. 18.8).
Table 18.5 shows the plankton count analyses in all samples from winter 2006 to summer 2010. The plankton counts
in summer were higher than in winter. Plankton was not observed in winter time except in the winter of 2008 and 2009.
The summer plankton counts ranged from 4 unit/ml in the
summer of 2006 to 14 unit/ml in the summer of 2010. The
plankton counts were found to be very low indicating that
the algal concentrations are very small and the occurrence of
eutrophication blooms is limited in the Mujib dam.
18.4 Site 3: Wadi Rajil Dam
18.4.1 General Information
Wadi Rajil is one of the streams feeding the Azraq Oasis;
its catchment extends into basalt covered Syrian territories,
Fig. 18.7 Temporal variations of the average nutrients
concentration of the Mujib
dam water
Nutrients concentration
0
2
4
6
8
10
12
14
16
18
W
2 0 0 6 S p
2 0 0 6 S u
2 0 0 6
W
2 0 0 7
S p
2 0 0 7 S u
2 0 0 7
W
2 0 0 8
W
2 0 0 9 S p
2 0 0 9
S u
2 0 0 9
W
2 0 1 0 S p
2 0 1 0
S u 2 0 1 0
Time
Concentration (mg/l)
NO 3 -
PO 4
-3
SiO 2
Fig. 18.8 Temporal variations of the average chlorophyll “a” concentration of the
Mujib dam water
Chlorophyll concentration
0
0.2
0.4
0.6
0.8
1
1.2
1.4
W
2 0 0 6
S p
2 0 0 6
S u
2 0 0 6
W
2 0 0 7
S p
2 0 0 7
S u
2 0 0 7
W
2 0 0 8
W
2 0 0 9
S p
2 0 0 9
S u
2 0 0 9
W
2 0 1 0
S p
2 0 1 0
S u
2 0 1 0
Time
Chlorophyll (ppb)
18 Ultraviolet Radiation and Bromide as Limiting Factors in Eutrophication Processes in Semiarid Climate Zones
18.3.2.3 BOD 5
The BOD 5 concentrations in all samples for 2006, 2007,
2008, 2009, and 2010 were less than 10 mg/l.
18.3.2.4 COD
The COD concentrations in all seasons were less than
20 mg/l except in the winter 2007 and winter 2008 when
values were more than 20 mg/l, but less than 30 mg/l.
18.3.2.5 TOC
The TOC concentrations in all samples were less than 2 mg/l.
18.3.2.6 Chlorophyll a and Plankton Count
The chlorophyll a concentrations showed small variations
between summer and winter seasons; the average values
ranged between 0.86 ppb in winter 2006 to 1.24 ppb in summer 2007. The chlorophyll a concentrations were found to
be higher in summer than in winter owing to higher temperatures, nutrient availability, and high light intensity. However,
in general the concentrations of chlorophyll a were very low
in Mujib dam water compared with other dams in Jordan
(e.g., Wadi Al Arab, King Talal Dam and King Abduallah
Canal (KAC))(Al-Harahsheh 2007) (Fig. 18.8).
Table 18.5 shows the plankton count analyses in all samples from winter 2006 to summer 2010. The plankton counts
in summer were higher than in winter. Plankton was not observed in winter time except in the winter of 2008 and 2009.
The summer plankton counts ranged from 4 unit/ml in the
summer of 2006 to 14 unit/ml in the summer of 2010. The
plankton counts were found to be very low indicating that
the algal concentrations are very small and the occurrence of
eutrophication blooms is limited in the Mujib dam.
18.4 Site 3: Wadi Rajil Dam
18.4.1 General Information
Wadi Rajil is one of the streams feeding the Azraq Oasis;
its catchment extends into basalt covered Syrian territories,
Fig. 18.7 Temporal variations of the average nutrients
concentration of the Mujib
dam water
Nutrients concentration
0
2
4
6
8
10
12
14
16
18
W
2 0 0 6 S p
2 0 0 6 S u
2 0 0 6
W
2 0 0 7
S p
2 0 0 7 S u
2 0 0 7
W
2 0 0 8
W
2 0 0 9 S p
2 0 0 9
S u
2 0 0 9
W
2 0 1 0 S p
2 0 1 0
S u 2 0 1 0
Time
Concentration (mg/l)
NO 3 -
PO 4
-3
SiO 2
Fig. 18.8 Temporal variations of the average chlorophyll “a” concentration of the
Mujib dam water
Chlorophyll concentration
0
0.2
0.4
0.6
0.8
1
1.2
1.4
W
2 0 0 6
S p
2 0 0 6
S u
2 0 0 6
W
2 0 0 7
S p
2 0 0 7
S u
2 0 0 7
W
2 0 0 8
W
2 0 0 9
S p
2 0 0 9
S u
2 0 0 9
W
2 0 1 0
S p
2 0 1 0
S u
2 0 1 0
Time
Chlorophyll (ppb)