

172
R. A. Ribeiro Filho et al.
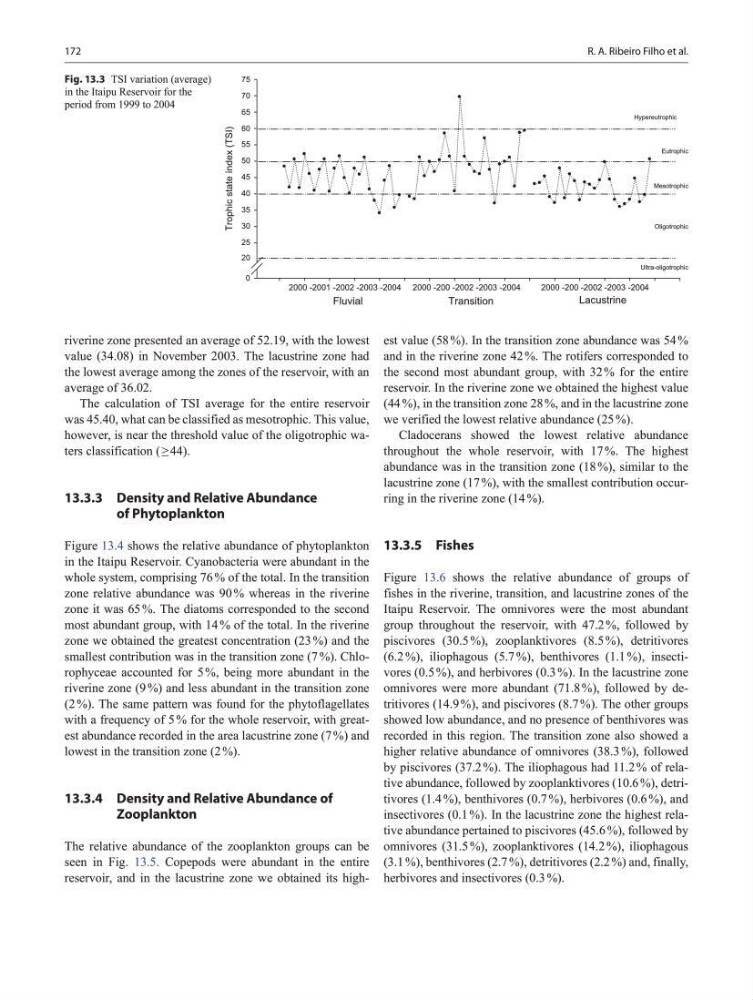
riverine zone presented an average of 52.19, with the lowest
value (34.08) in November 2003. The lacustrine zone had
the lowest average among the zones of the reservoir, with an
average of 36.02.
The calculation of TSI average for the entire reservoir
was 45.40, what can be classified as mesotrophic. This value,
however, is near the threshold value of the oligotrophic waters classification ( ≥ 44).
13.3.3 Density and Relative Abundance
of Phytoplankton
Figure 13.4 shows the relative abundance of phytoplankton
in the Itaipu Reservoir. Cyanobacteria were abundant in the
whole system, comprising 76 % of the total. In the transition
zone relative abundance was 90 % whereas in the riverine
zone it was 65 %. The diatoms corresponded to the second
most abundant group, with 14 % of the total. In the riverine
zone we obtained the greatest concentration (23 %) and the
smallest contribution was in the transition zone (7 %). Chlorophyceae accounted for 5 %, being more abundant in the
riverine zone (9 %) and less abundant in the transition zone
(2 %). The same pattern was found for the phytoflagellates
with a frequency of 5 % for the whole reservoir, with greatest abundance recorded in the area lacustrine zone (7 %) and
lowest in the transition zone (2 %).
13.3.4 Density and Relative Abundance of
Zooplankton
The relative abundance of the zooplankton groups can be
seen in Fig. 13.5. Copepods were abundant in the entire
reservoir, and in the lacustrine zone we obtained its highest value (58 %). In the transition zone abundance was 54 %
and in the riverine zone 42 %. The rotifers corresponded to
the second most abundant group, with 32 % for the entire
reservoir. In the riverine zone we obtained the highest value
(44 %), in the transition zone 28 %, and in the lacustrine zone
we verified the lowest relative abundance (25 %).
Cladocerans showed the lowest relative abundance
throughout the whole reservoir, with 17 %. The highest
abundance was in the transition zone (18 %), similar to the
lacustrine zone (17 %), with the smallest contribution occurring in the riverine zone (14 %).
13.3.5 Fishes
Figure 13.6 shows the relative abundance of groups of
fishes in the riverine, transition, and lacustrine zones of the
Itaipu Reservoir. The omnivores were the most abundant
group throughout the reservoir, with 47.2 %, followed by
piscivores (30.5 %), zooplanktivores (8.5 %), detritivores
(6.2 %), iliophagous (5.7 %), benthivores (1.1 %), insectivores (0.5 %), and herbivores (0.3 %). In the lacustrine zone
omnivores were more abundant (71.8 %), followed by detritivores (14.9 %), and piscivores (8.7 %). The other groups
showed low abundance, and no presence of benthivores was
recorded in this region. The transition zone also showed a
higher relative abundance of omnivores (38.3 %), followed
by piscivores (37.2 %). The iliophagous had 11.2 % of relative abundance, followed by zooplanktivores (10.6 %), detritivores (1.4 %), benthivores (0.7 %), herbivores (0.6 %), and
insectivores (0.1 %). In the lacustrine zone the highest relative abundance pertained to piscivores (45.6 %), followed by
omnivores (31.5 %), zooplanktivores (14.2 %), iliophagous
(3.1 %), benthivores (2.7 %), detritivores (2.2 %) and, finally,
herbivores and insectivores (0.3 %).
Trophic state índex (TSI)
0
20
25
30
35
40
45
50
55
60
65
70
75
Hypereutrophic
Eutrophic
Mesotrophic
Oligotrophic
Ultra-oligotrophic
2000 -200 -2002 -2003 -2004
2000 -200 -2002 -2003 -2004
Fluvial
Transition
Lacustrine
2000 -2001 -2002 -2003 -2004
Fig. 13.3 TSI variation (average)
in the Itaipu Reservoir for the
period from 1999 to 2004
R. A. Ribeiro Filho et al.
riverine zone presented an average of 52.19, with the lowest
value (34.08) in November 2003. The lacustrine zone had
the lowest average among the zones of the reservoir, with an
average of 36.02.
The calculation of TSI average for the entire reservoir
was 45.40, what can be classified as mesotrophic. This value,
however, is near the threshold value of the oligotrophic waters classification ( ≥ 44).
13.3.3 Density and Relative Abundance
of Phytoplankton
Figure 13.4 shows the relative abundance of phytoplankton
in the Itaipu Reservoir. Cyanobacteria were abundant in the
whole system, comprising 76 % of the total. In the transition
zone relative abundance was 90 % whereas in the riverine
zone it was 65 %. The diatoms corresponded to the second
most abundant group, with 14 % of the total. In the riverine
zone we obtained the greatest concentration (23 %) and the
smallest contribution was in the transition zone (7 %). Chlorophyceae accounted for 5 %, being more abundant in the
riverine zone (9 %) and less abundant in the transition zone
(2 %). The same pattern was found for the phytoflagellates
with a frequency of 5 % for the whole reservoir, with greatest abundance recorded in the area lacustrine zone (7 %) and
lowest in the transition zone (2 %).
13.3.4 Density and Relative Abundance of
Zooplankton
The relative abundance of the zooplankton groups can be
seen in Fig. 13.5. Copepods were abundant in the entire
reservoir, and in the lacustrine zone we obtained its highest value (58 %). In the transition zone abundance was 54 %
and in the riverine zone 42 %. The rotifers corresponded to
the second most abundant group, with 32 % for the entire
reservoir. In the riverine zone we obtained the highest value
(44 %), in the transition zone 28 %, and in the lacustrine zone
we verified the lowest relative abundance (25 %).
Cladocerans showed the lowest relative abundance
throughout the whole reservoir, with 17 %. The highest
abundance was in the transition zone (18 %), similar to the
lacustrine zone (17 %), with the smallest contribution occurring in the riverine zone (14 %).
13.3.5 Fishes
Figure 13.6 shows the relative abundance of groups of
fishes in the riverine, transition, and lacustrine zones of the
Itaipu Reservoir. The omnivores were the most abundant
group throughout the reservoir, with 47.2 %, followed by
piscivores (30.5 %), zooplanktivores (8.5 %), detritivores
(6.2 %), iliophagous (5.7 %), benthivores (1.1 %), insectivores (0.5 %), and herbivores (0.3 %). In the lacustrine zone
omnivores were more abundant (71.8 %), followed by detritivores (14.9 %), and piscivores (8.7 %). The other groups
showed low abundance, and no presence of benthivores was
recorded in this region. The transition zone also showed a
higher relative abundance of omnivores (38.3 %), followed
by piscivores (37.2 %). The iliophagous had 11.2 % of relative abundance, followed by zooplanktivores (10.6 %), detritivores (1.4 %), benthivores (0.7 %), herbivores (0.6 %), and
insectivores (0.1 %). In the lacustrine zone the highest relative abundance pertained to piscivores (45.6 %), followed by
omnivores (31.5 %), zooplanktivores (14.2 %), iliophagous
(3.1 %), benthivores (2.7 %), detritivores (2.2 %) and, finally,
herbivores and insectivores (0.3 %).
Trophic state índex (TSI)
0
20
25
30
35
40
45
50
55
60
65
70
75
Hypereutrophic
Eutrophic
Mesotrophic
Oligotrophic
Ultra-oligotrophic
2000 -200 -2002 -2003 -2004
2000 -200 -2002 -2003 -2004
Fluvial
Transition
Lacustrine
2000 -2001 -2002 -2003 -2004
Fig. 13.3 TSI variation (average)
in the Itaipu Reservoir for the
period from 1999 to 2004