

171
13 Estimating Fish Production in the Itaipu Reservoir (Brazil): The Relationship Between Fish Trophic Guilds, Limnology …
(R = 0.550, R
2
= 0.302, F = 39.586, N = 278, p ≤ 0.05), being
expressed by the following model. According to this analysis,
the concentration of chlorophyll-a (dependent variable) can
be explained by a linear combination of independent variables, indicating that all the variables tested contributed to
the development of phytoplankton, while the only negative
effect was the variable water transparency.
In order to establish which other variables contributed to
the development of phytoplankton (through chlorophyll-a
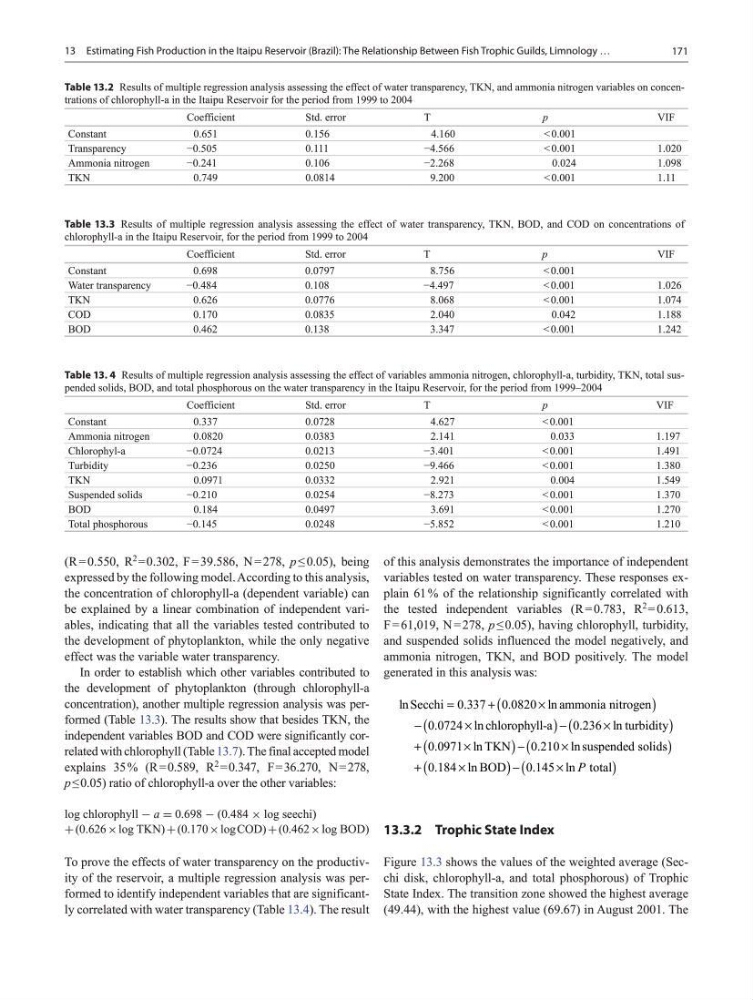
concentration), another multiple regression analysis was performed (Table 13.3). The results show that besides TKN, the
independent variables BOD and COD were significantly correlated with chlorophyll (Table 13.7). The final accepted model
explains 35 % (R = 0.589, R
2
= 0.347, F = 36.270, N = 278,
p ≤ 0.05) ratio of chlorophyll-a over the other variables:
To prove the effects of water transparency on the productivity of the reservoir, a multiple regression analysis was performed to identify independent variables that are significantly correlated with water transparency (Table 13.4). The result
log chlorophyll − a = 0.698 − (0.484 × log seechi)
+ (0.626 × log TKN) + (0.170 × log COD) + (0.462 × log BOD)
of this analysis demonstrates the importance of independent
variables tested on water transparency. These responses explain 61 % of the relationship significantly correlated with
the tested independent variables (R = 0.783, R
2
= 0.613,
F = 61,019, N = 278, p ≤ 0.05), having chlorophyll, turbidity,
and suspended solids influenced the model negatively, and
ammonia nitrogen, TKN, and BOD positively. The model
generated in this analysis was:
(
)
(
) (
)
(
) (
)
(
) (
)
ln Secchi 0.337 0.0820 ln ammonia nitrogen
0.0724 ln chlorophyll-a
0.236 ln turbidity
0.0971 ln TKN
0.210 ln suspended solids
0.184 ln BOD
0.145 ln total
P
=
+
×
−
×
−
×
+
×
−
×
+
×
−
×
13.3.2 Trophic State Index
Figure 13.3 shows the values of the weighted average (Secchi disk, chlorophyll-a, and total phosphorous) of Trophic
State Index. The transition zone showed the highest average
(49.44), with the highest value (69.67) in August 2001. The
Table 13.2 Results of multiple regression analysis assessing the effect of water transparency, TKN, and ammonia nitrogen variables on concentrations of chlorophyll-a in the Itaipu Reservoir for the period from 1999 to 2004
Coefficient
Std. error
T
p
VIF
Constant
0.651
0.156
4.160
< 0.001
Transparency
−0.505
0.111
−4.566
< 0.001
1.020
Ammonia nitrogen
−0.241
0.106
−2.268
0.024
1.098
TKN
0.749
0.0814
9.200
< 0.001
1.11
Table 13.3 Results of multiple regression analysis assessing the effect of water transparency, TKN, BOD, and COD on concentrations of
chlorophyll-a in the Itaipu Reservoir, for the period from 1999 to 2004
Coefficient
Std. error
T
p
VIF
Constant
0.698
0.0797
8.756
< 0.001
Water transparency
−0.484
0.108
−4.497
< 0.001
1.026
TKN
0.626
0.0776
8.068
< 0.001
1.074
COD
0.170
0.0835
2.040
0.042
1.188
BOD
0.462
0.138
3.347
< 0.001
1.242
Table 13. 4 Results of multiple regression analysis assessing the effect of variables ammonia nitrogen, chlorophyll-a, turbidity, TKN, total suspended solids, BOD, and total phosphorous on the water transparency in the Itaipu Reservoir, for the period from 1999–2004
Coefficient
Std. error
T
p
VIF
Constant
0.337
0.0728
4.627
< 0.001
Ammonia nitrogen
0.0820
0.0383
2.141
0.033
1.197
Chlorophyl-a
−0.0724
0.0213
−3.401
< 0.001
1.491
Turbidity
−0.236
0.0250
−9.466
< 0.001
1.380
TKN
0.0971
0.0332
2.921
0.004
1.549
Suspended solids
−0.210
0.0254
−8.273
< 0.001
1.370
BOD
0.184
0.0497
3.691
< 0.001
1.270
Total phosphorous
−0.145
0.0248
−5.852
< 0.001
1.210
13 Estimating Fish Production in the Itaipu Reservoir (Brazil): The Relationship Between Fish Trophic Guilds, Limnology …
(R = 0.550, R
2
= 0.302, F = 39.586, N = 278, p ≤ 0.05), being
expressed by the following model. According to this analysis,
the concentration of chlorophyll-a (dependent variable) can
be explained by a linear combination of independent variables, indicating that all the variables tested contributed to
the development of phytoplankton, while the only negative
effect was the variable water transparency.
In order to establish which other variables contributed to
the development of phytoplankton (through chlorophyll-a
concentration), another multiple regression analysis was performed (Table 13.3). The results show that besides TKN, the
independent variables BOD and COD were significantly correlated with chlorophyll (Table 13.7). The final accepted model
explains 35 % (R = 0.589, R
2
= 0.347, F = 36.270, N = 278,
p ≤ 0.05) ratio of chlorophyll-a over the other variables:
To prove the effects of water transparency on the productivity of the reservoir, a multiple regression analysis was performed to identify independent variables that are significantly correlated with water transparency (Table 13.4). The result
log chlorophyll − a = 0.698 − (0.484 × log seechi)
+ (0.626 × log TKN) + (0.170 × log COD) + (0.462 × log BOD)
of this analysis demonstrates the importance of independent
variables tested on water transparency. These responses explain 61 % of the relationship significantly correlated with
the tested independent variables (R = 0.783, R
2
= 0.613,
F = 61,019, N = 278, p ≤ 0.05), having chlorophyll, turbidity,
and suspended solids influenced the model negatively, and
ammonia nitrogen, TKN, and BOD positively. The model
generated in this analysis was:
(
)
(
) (
)
(
) (
)
(
) (
)
ln Secchi 0.337 0.0820 ln ammonia nitrogen
0.0724 ln chlorophyll-a
0.236 ln turbidity
0.0971 ln TKN
0.210 ln suspended solids
0.184 ln BOD
0.145 ln total
P
=
+
×
−
×
−
×
+
×
−
×
+
×
−
×
13.3.2 Trophic State Index
Figure 13.3 shows the values of the weighted average (Secchi disk, chlorophyll-a, and total phosphorous) of Trophic
State Index. The transition zone showed the highest average
(49.44), with the highest value (69.67) in August 2001. The
Table 13.2 Results of multiple regression analysis assessing the effect of water transparency, TKN, and ammonia nitrogen variables on concentrations of chlorophyll-a in the Itaipu Reservoir for the period from 1999 to 2004
Coefficient
Std. error
T
p
VIF
Constant
0.651
0.156
4.160
< 0.001
Transparency
−0.505
0.111
−4.566
< 0.001
1.020
Ammonia nitrogen
−0.241
0.106
−2.268
0.024
1.098
TKN
0.749
0.0814
9.200
< 0.001
1.11
Table 13.3 Results of multiple regression analysis assessing the effect of water transparency, TKN, BOD, and COD on concentrations of
chlorophyll-a in the Itaipu Reservoir, for the period from 1999 to 2004
Coefficient
Std. error
T
p
VIF
Constant
0.698
0.0797
8.756
< 0.001
Water transparency
−0.484
0.108
−4.497
< 0.001
1.026
TKN
0.626
0.0776
8.068
< 0.001
1.074
COD
0.170
0.0835
2.040
0.042
1.188
BOD
0.462
0.138
3.347
< 0.001
1.242
Table 13. 4 Results of multiple regression analysis assessing the effect of variables ammonia nitrogen, chlorophyll-a, turbidity, TKN, total suspended solids, BOD, and total phosphorous on the water transparency in the Itaipu Reservoir, for the period from 1999–2004
Coefficient
Std. error
T
p
VIF
Constant
0.337
0.0728
4.627
< 0.001
Ammonia nitrogen
0.0820
0.0383
2.141
0.033
1.197
Chlorophyl-a
−0.0724
0.0213
−3.401
< 0.001
1.491
Turbidity
−0.236
0.0250
−9.466
< 0.001
1.380
TKN
0.0971
0.0332
2.921
0.004
1.549
Suspended solids
−0.210
0.0254
−8.273
< 0.001
1.370
BOD
0.184
0.0497
3.691
< 0.001
1.270
Total phosphorous
−0.145
0.0248
−5.852
< 0.001
1.210