

170
R. A. Ribeiro Filho et al.
vores and detritivores) as dependent variables, what turned
out to be of relevance in the linear regression analyses performed. The analyses follow the same protocol of the abiotic
variables analyses.
13.2.5 Trophic State Index (TSI)
In order to assess the trophic state of the Itaipu Reservoir,
we used the trophic state index proposed by CARLSON and
modified by Toledo Jr et al. (1983), as described below:
0.64 ln Secchi
TSI (Secchi) 10 6
ln 2
+
=
−
{
}
ln 80.32 / total
TSI ( Total) 10 6
ln 2
P
P
=
−
2.04 0.695*ln Chlorophyll-a
TSI (Chlorophyll) 10 6
ln 2
−
=
−
To determine TSI (mean), the calculation of the index was
done using the weighted average by assigning a lower weight
to the transparency of water, as suggested by Toledo Jr et al.
(1983). Thus, to calculate the TSI (mean), we used the following formula:
TSI( total)
TSI (Secchi) 2 TSI(Chlorophyll-a)
TSI (Mean)
5
P
+
+
=
13.2.6 Estimate of Fishing Yield
Through Morfoedaphic Index (MEI) of RYDER (1965), we
estimated fishing yield and the MEI was expressed by the
following equation:
TDS
conductivity
MEI =
or MEI =
zm
zm
Where TDS = concentration of dissolved solids (mg/L) and
zm = average depth (m).
13.2.7 Inference of Fishing Yield
In order to estimate the fishing yield of the Itaipu reservoir
and verify if the predicted index values were significant
we used the equation proposed by Meleck (1976), with the
model derived from a capture data regression analysis and
MEI (morfoedaphic index):
The index below (MEI) is a relationship between the concentrations of dissolved solids in water divided by the mean
depth of the lake or reservoir, and was first used by Ryder
(1965) to estimate the fishing yield of African lakes. Oglesby
(1977) found that a better fit could be obtained for MEI expressed as the relation between conductivity and the average
depth:
–1
conductivity ( S.cm )
MEI
average depth (m)
µ
=
13.3 Results
13.3.1 Relationships Between the Limnological
Variables
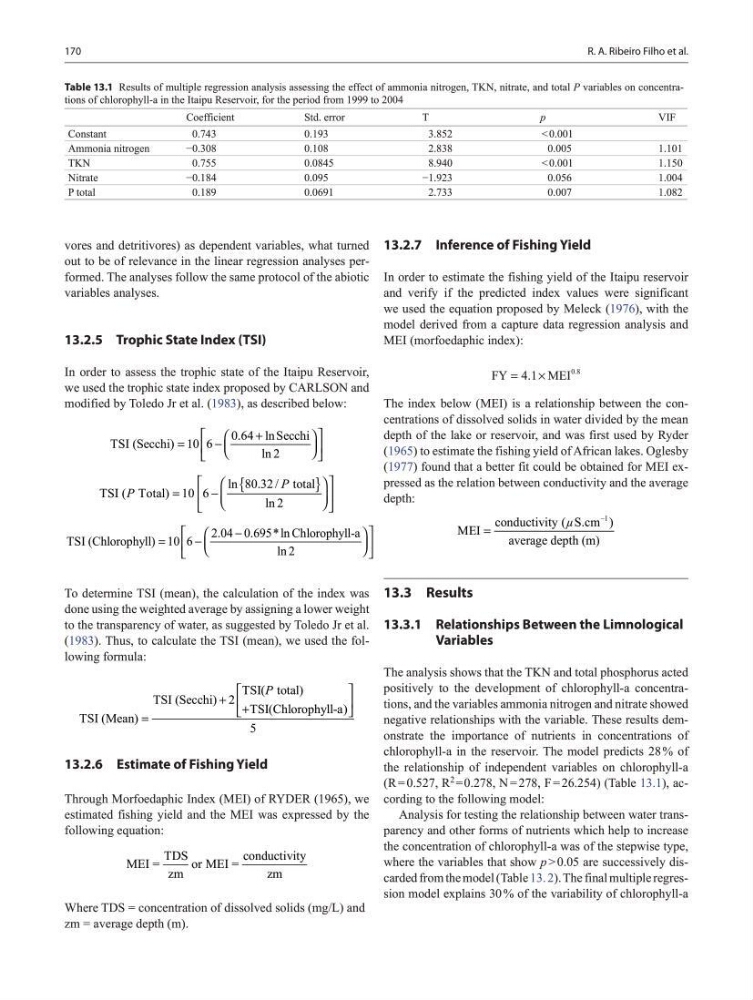
The analysis shows that the TKN and total phosphorus acted
positively to the development of chlorophyll-a concentrations, and the variables ammonia nitrogen and nitrate showed
negative relationships with the variable. These results demonstrate the importance of nutrients in concentrations of
chlorophyll-a in the reservoir. The model predicts 28 % of
the relationship of independent variables on chlorophyll-a
(R = 0.527, R
2
= 0.278, N = 278, F = 26.254) (Table 13.1), according to the following model:
Analysis for testing the relationship between water transparency and other forms of nutrients which help to increase
the concentration of chlorophyll-a was of the stepwise type,
where the variables that show p > 0.05 are successively discarded from the model (Table 13. 2). The final multiple regression model explains 30 % of the variability of chlorophyll-a
FY
MEI
=
×
4 1
0 8
.
.
Table 13.1 Results of multiple regression analysis assessing the effect of ammonia nitrogen, TKN, nitrate, and total P variables on concentrations of chlorophyll-a in the Itaipu Reservoir, for the period from 1999 to 2004
Coefficient
Std. error
T
p
VIF
Constant
0.743
0.193
3.852
< 0.001
Ammonia nitrogen
−0.308
0.108
2.838
0.005
1.101
TKN
0.755
0.0845
8.940
< 0.001
1.150
Nitrate
−0.184
0.095
−1.923
0.056
1.004
P total
0.189
0.0691
2.733
0.007
1.082
R. A. Ribeiro Filho et al.
vores and detritivores) as dependent variables, what turned
out to be of relevance in the linear regression analyses performed. The analyses follow the same protocol of the abiotic
variables analyses.
13.2.5 Trophic State Index (TSI)
In order to assess the trophic state of the Itaipu Reservoir,
we used the trophic state index proposed by CARLSON and
modified by Toledo Jr et al. (1983), as described below:
0.64 ln Secchi
TSI (Secchi) 10 6
ln 2
+
=
−
{
}
ln 80.32 / total
TSI ( Total) 10 6
ln 2
P
P
=
−
2.04 0.695*ln Chlorophyll-a
TSI (Chlorophyll) 10 6
ln 2
−
=
−
To determine TSI (mean), the calculation of the index was
done using the weighted average by assigning a lower weight
to the transparency of water, as suggested by Toledo Jr et al.
(1983). Thus, to calculate the TSI (mean), we used the following formula:
TSI( total)
TSI (Secchi) 2 TSI(Chlorophyll-a)
TSI (Mean)
5
P
+
+
=
13.2.6 Estimate of Fishing Yield
Through Morfoedaphic Index (MEI) of RYDER (1965), we
estimated fishing yield and the MEI was expressed by the
following equation:
TDS
conductivity
MEI =
or MEI =
zm
zm
Where TDS = concentration of dissolved solids (mg/L) and
zm = average depth (m).
13.2.7 Inference of Fishing Yield
In order to estimate the fishing yield of the Itaipu reservoir
and verify if the predicted index values were significant
we used the equation proposed by Meleck (1976), with the
model derived from a capture data regression analysis and
MEI (morfoedaphic index):
The index below (MEI) is a relationship between the concentrations of dissolved solids in water divided by the mean
depth of the lake or reservoir, and was first used by Ryder
(1965) to estimate the fishing yield of African lakes. Oglesby
(1977) found that a better fit could be obtained for MEI expressed as the relation between conductivity and the average
depth:
–1
conductivity ( S.cm )
MEI
average depth (m)
µ
=
13.3 Results
13.3.1 Relationships Between the Limnological
Variables
The analysis shows that the TKN and total phosphorus acted
positively to the development of chlorophyll-a concentrations, and the variables ammonia nitrogen and nitrate showed
negative relationships with the variable. These results demonstrate the importance of nutrients in concentrations of
chlorophyll-a in the reservoir. The model predicts 28 % of
the relationship of independent variables on chlorophyll-a
(R = 0.527, R
2
= 0.278, N = 278, F = 26.254) (Table 13.1), according to the following model:
Analysis for testing the relationship between water transparency and other forms of nutrients which help to increase
the concentration of chlorophyll-a was of the stepwise type,
where the variables that show p > 0.05 are successively discarded from the model (Table 13. 2). The final multiple regression model explains 30 % of the variability of chlorophyll-a
FY
MEI
=
×
4 1
0 8
.
.
Table 13.1 Results of multiple regression analysis assessing the effect of ammonia nitrogen, TKN, nitrate, and total P variables on concentrations of chlorophyll-a in the Itaipu Reservoir, for the period from 1999 to 2004
Coefficient
Std. error
T
p
VIF
Constant
0.743
0.193
3.852
< 0.001
Ammonia nitrogen
−0.308
0.108
2.838
0.005
1.101
TKN
0.755
0.0845
8.940
< 0.001
1.150
Nitrate
−0.184
0.095
−1.923
0.056
1.004
P total
0.189
0.0691
2.733
0.007
1.082