

169
13 Estimating Fish Production in the Itaipu Reservoir (Brazil): The Relationship Between Fish Trophic Guilds, Limnology …
temperature, dissolved oxygen concentration and percentage
of saturation, pH, electrical conductivity, and water transparency. Other physical and chemical variables, such as alkalinity, total nitrogen Kjeldahl (TKN) nitrate, nitrite, ammonia
and nitrogen, total solids, suspended solids, BOD, COD, and
total phosphorus were analyzed in the laboratory, according
to APHA (1985), as well as the concentration of chlorophylla (NUSCH, 1980). The analysis protocols were presented by
Ribeiro Filho (2005).
The climatological data were obtained from weather stations in the cities of Guaira (riverine area), Entre Rios do
Oeste (transition zone), and Iguazu Falls (lacustrine-downstream zone).
Data on fishes were grouped into trophic guilds, according to Oliveira et al. (2005). They presented the relative densities, calculated from numerical abundance in kilograms,
corresponding to the weight of gutted fish without a head.
The relative abundance of phytoplankton, zooplankton,
and fish were presented according to the regions (riverine,
transition, and lacustrine) of the reservoir to enable the comparison of the spatial distribution patterns.
13.2.4 Statistical Analysis of Data
To test the trophic cascade hypothesis in the reservoir,we
performed linear regression analyses among the physical,
chemical, biological, and trophic guilds, and trophic levels
were analyzed one by one, determining the interactions between them. These analyses were performed in accordance
with food web models (Top down and Bottom up) (Carpenter et al. 1985; Mcqueen et al. 1986; Lazzaro 1997; Lazzaro
et al. 2003). The graphs were evaluated to determine whether
the relationships were linear or not. To stabilize the variance,
the Neperian logarithms were taken for all limnological variables. Graphically, limnological variables were expressed
according to the equation below:
In var = In(var)
where var is the original value of the limnological variable;
ln var is the transformed value of var.
For biotic variables, in order to minimize null values, the
transformation was performed according to the following
equation, based on absolute numerical abundance:
In bio = In(bio + 1)
where bio is the original value of the biotic variable + 1, ln
bio is the transformed value of bio.
In the analysis of residues, assumptions of linearity, normality, and homoskedasticity were confirmed.
To test the effect of limnological and fish biomass on chlorophyll-a and cyanobacteria we carried out multiple regression analyses following the stepwise procedure, in which all
variables were tested, and as they did not produce any significant results, they were one by one discarded from the model.
To test the hypothesis that the chlorophyll-a, and therefore the productivity of the reservoir, depends on the concentration of nutrients, a multiple regression analysis was
performed. The concentration of chlorophyll-a was considered a dependent variable, and was plotted with the forms of
nutrients (independent variable), and only those that showed
significant results remain present in the final model.
In order to detect possible relationships between the biotic and abiotic variables we carried out multiple regression
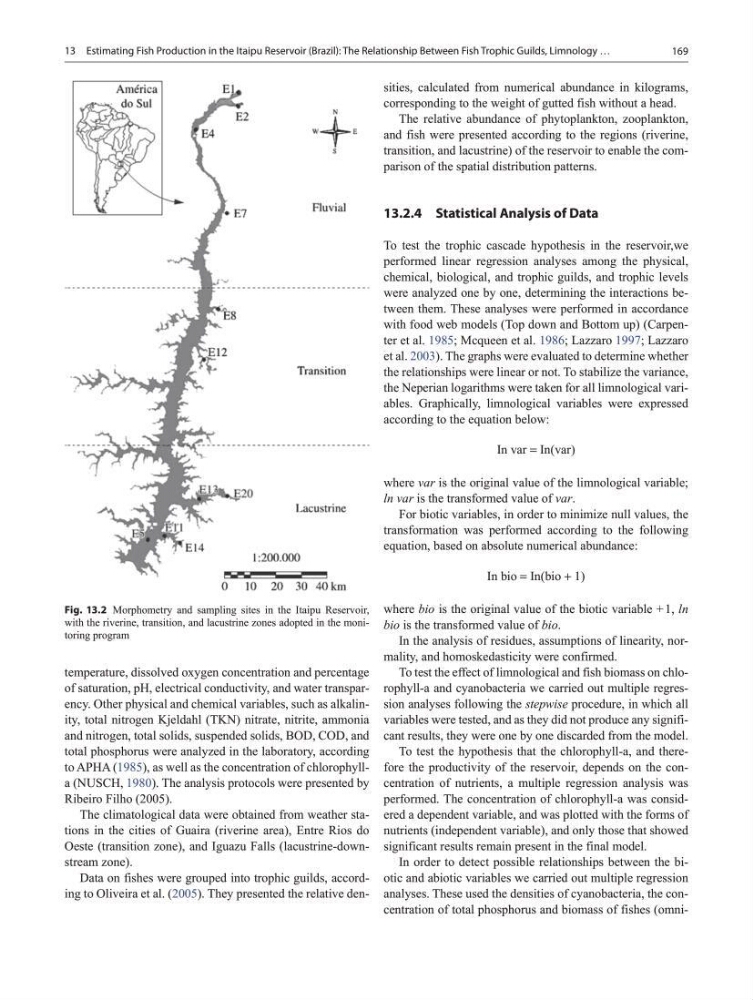
analyses. These used the densities of cyanobacteria, the concentration of total phosphorus and biomass of fishes (omniFig. 13.2 Morphometry and sampling sites in the Itaipu Reservoir,
with the riverine, transition, and lacustrine zones adopted in the monitoring program
13 Estimating Fish Production in the Itaipu Reservoir (Brazil): The Relationship Between Fish Trophic Guilds, Limnology …
temperature, dissolved oxygen concentration and percentage
of saturation, pH, electrical conductivity, and water transparency. Other physical and chemical variables, such as alkalinity, total nitrogen Kjeldahl (TKN) nitrate, nitrite, ammonia
and nitrogen, total solids, suspended solids, BOD, COD, and
total phosphorus were analyzed in the laboratory, according
to APHA (1985), as well as the concentration of chlorophylla (NUSCH, 1980). The analysis protocols were presented by
Ribeiro Filho (2005).
The climatological data were obtained from weather stations in the cities of Guaira (riverine area), Entre Rios do
Oeste (transition zone), and Iguazu Falls (lacustrine-downstream zone).
Data on fishes were grouped into trophic guilds, according to Oliveira et al. (2005). They presented the relative densities, calculated from numerical abundance in kilograms,
corresponding to the weight of gutted fish without a head.
The relative abundance of phytoplankton, zooplankton,
and fish were presented according to the regions (riverine,
transition, and lacustrine) of the reservoir to enable the comparison of the spatial distribution patterns.
13.2.4 Statistical Analysis of Data
To test the trophic cascade hypothesis in the reservoir,we
performed linear regression analyses among the physical,
chemical, biological, and trophic guilds, and trophic levels
were analyzed one by one, determining the interactions between them. These analyses were performed in accordance
with food web models (Top down and Bottom up) (Carpenter et al. 1985; Mcqueen et al. 1986; Lazzaro 1997; Lazzaro
et al. 2003). The graphs were evaluated to determine whether
the relationships were linear or not. To stabilize the variance,
the Neperian logarithms were taken for all limnological variables. Graphically, limnological variables were expressed
according to the equation below:
In var = In(var)
where var is the original value of the limnological variable;
ln var is the transformed value of var.
For biotic variables, in order to minimize null values, the
transformation was performed according to the following
equation, based on absolute numerical abundance:
In bio = In(bio + 1)
where bio is the original value of the biotic variable + 1, ln
bio is the transformed value of bio.
In the analysis of residues, assumptions of linearity, normality, and homoskedasticity were confirmed.
To test the effect of limnological and fish biomass on chlorophyll-a and cyanobacteria we carried out multiple regression analyses following the stepwise procedure, in which all
variables were tested, and as they did not produce any significant results, they were one by one discarded from the model.
To test the hypothesis that the chlorophyll-a, and therefore the productivity of the reservoir, depends on the concentration of nutrients, a multiple regression analysis was
performed. The concentration of chlorophyll-a was considered a dependent variable, and was plotted with the forms of
nutrients (independent variable), and only those that showed
significant results remain present in the final model.
In order to detect possible relationships between the biotic and abiotic variables we carried out multiple regression
analyses. These used the densities of cyanobacteria, the concentration of total phosphorus and biomass of fishes (omniFig. 13.2 Morphometry and sampling sites in the Itaipu Reservoir,
with the riverine, transition, and lacustrine zones adopted in the monitoring program