

149
12 Household Detergents Causing Eutrophication in Freshwater Ecosystems
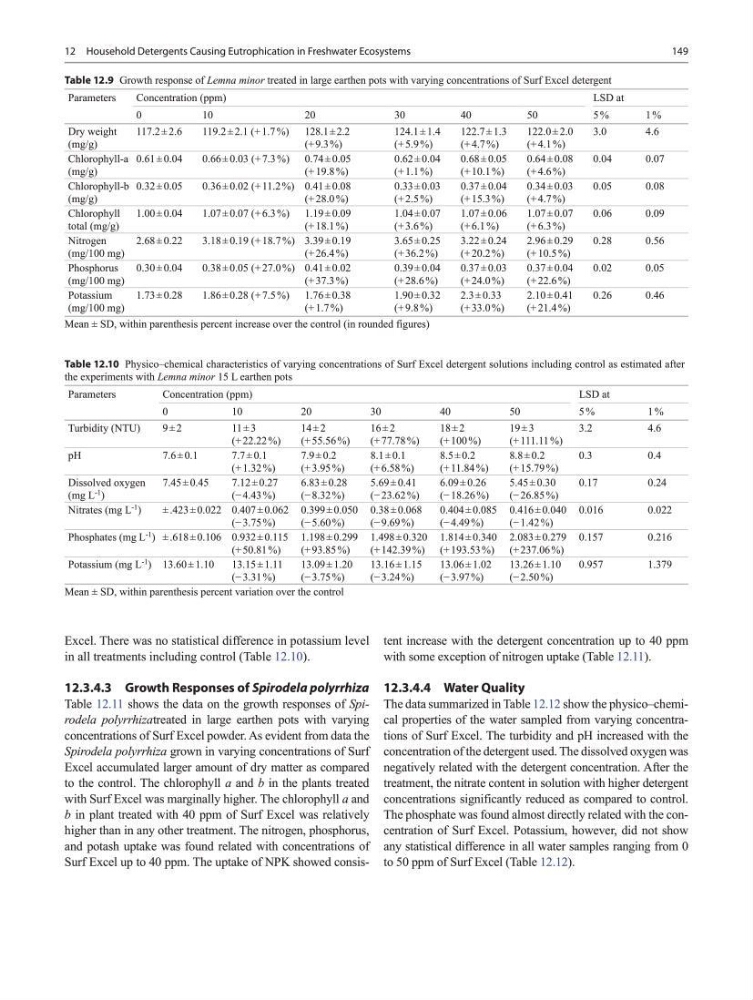
Excel. There was no statistical difference in potassium level
in all treatments including control (Table 12.10).
12.3.4.3 Growth Responses of Spirodela polyrrhiza
Table 12.11 shows the data on the growth responses of Spirodela polyrrhizatreated in large earthen pots with varying
concentrations of Surf Excel powder. As evident from data the
Spirodela polyrrhiza grown in varying concentrations of Surf
Excel accumulated larger amount of dry matter as compared
to the control. The chlorophyll a and b in the plants treated
with Surf Excel was marginally higher. The chlorophyll a and
b in plant treated with 40 ppm of Surf Excel was relatively
higher than in any other treatment. The nitrogen, phosphorus,
and potash uptake was found related with concentrations of
Surf Excel up to 40 ppm. The uptake of NPK showed consistent increase with the detergent concentration up to 40 ppm
with some exception of nitrogen uptake (Table 12.11).
12.3.4.4 Water Quality
The data summarized in Table 12.12 show the physico–chemical properties of the water sampled from varying concentrations of Surf Excel. The turbidity and pH increased with the
concentration of the detergent used. The dissolved oxygen was
negatively related with the detergent concentration. After the
treatment, the nitrate content in solution with higher detergent
concentrations significantly reduced as compared to control.
The phosphate was found almost directly related with the concentration of Surf Excel. Potassium, however, did not show
any statistical difference in all water samples ranging from 0
to 50 ppm of Surf Excel (Table 12.12).
Table 12.9 Growth response of Lemna minor treated in large earthen pots with varying concentrations of Surf Excel detergent
Parameters
Concentration (ppm)
LSD at
0
10
20
30
40
50
5 %
1 %
Dry weight
(mg/g)
117.2 ± 2.6
119.2 ± 2.1 (+ 1.7 %) 128.1 ± 2.2
(+ 9.3 %)
124.1 ± 1.4
(+ 5.9 %)
122.7 ± 1.3
(+ 4.7 %)
122.0 ± 2.0
(+ 4.1 %)
3.0
4.6
Chlorophyll-a
(mg/g)
0.61 ± 0.04
0.66 ± 0.03 (+ 7.3 %) 0.74 ± 0.05
(+ 19.8 %)
0.62 ± 0.04
(+ 1.1 %)
0.68 ± 0.05
(+ 10.1 %)
0.64 ± 0.08
(+ 4.6 %)
0.04
0.07
Chlorophyll-b
(mg/g)
0.32 ± 0.05
0.36 ± 0.02 (+ 11.2 %) 0.41 ± 0.08
(+ 28.0 %)
0.33 ± 0.03
(+ 2.5 %)
0.37 ± 0.04
(+ 15.3 %)
0.34 ± 0.03
(+ 4.7 %)
0.05
0.08
Chlorophyll
total (mg/g)
1.00 ± 0.04
1.07 ± 0.07 (+ 6.3 %) 1.19 ± 0.09
(+ 18.1 %)
1.04 ± 0.07
(+ 3.6 %)
1.07 ± 0.06
(+ 6.1 %)
1.07 ± 0.07
(+ 6.3 %)
0.06
0.09
Nitrogen
(mg/100 mg)
2.68 ± 0.22
3.18 ± 0.19 (+ 18.7 %) 3.39 ± 0.19
(+ 26.4 %)
3.65 ± 0.25
(+ 36.2 %)
3.22 ± 0.24
(+ 20.2 %)
2.96 ± 0.29
(+ 10.5 %)
0.28
0.56
Phosphorus
(mg/100 mg)
0.30 ± 0.04
0.38 ± 0.05 (+ 27.0 %) 0.41 ± 0.02
(+ 37.3 %)
0.39 ± 0.04
(+ 28.6 %)
0.37 ± 0.03
(+ 24.0 %)
0.37 ± 0.04
(+ 22.6 %)
0.02
0.05
Potassium
(mg/100 mg)
1.73 ± 0.28
1.86 ± 0.28 (+ 7.5 %) 1.76 ± 0.38
(+ 1.7 %)
1.90 ± 0.32
(+ 9.8 %)
2.3 ± 0.33
(+ 33.0 %)
2.10 ± 0.41
(+ 21.4 %)
0.26
0.46
Mean ± SD, within parenthesis percent increase over the control (in rounded figures)
Table 12.10 Physico–chemical characteristics of varying concentrations of Surf Excel detergent solutions including control as estimated after
the experiments with Lemna minor 15 L earthen pots
Parameters
Concentration (ppm)
LSD at
0
10
20
30
40
50
5 %
1 %
Turbidity (NTU)
9 ± 2
11 ± 3
(+ 22.22 %)
14 ± 2
(+ 55.56 %)
16 ± 2
(+ 77.78 %)
18 ± 2
(+ 100 %)
19 ± 3
(+ 111.11 %)
3.2
4.6
pH
7.6 ± 0.1
7.7 ± 0.1
(+ 1.32 %)
7.9 ± 0.2
(+ 3.95 %)
8.1 ± 0.1
(+ 6.58 %)
8.5 ± 0.2
(+ 11.84 %)
8.8 ± 0.2
(+ 15.79 %)
0.3
0.4
Dissolved oxygen
(mg L -1 )
7.45 ± 0.45
7.12 ± 0.27
(− 4.43 %)
6.83 ± 0.28
(− 8.32 %)
5.69 ± 0.41
(− 23.62 %)
6.09 ± 0.26
(− 18.26 %)
5.45 ± 0.30
(− 26.85 %)
0.17
0.24
Nitrates (mg L
-1
)
± .423 ± 0.022 0.407 ± 0.062
(− 3.75 %)
0.399 ± 0.050
(− 5.60 %)
0.38 ± 0.068
(− 9.69 %)
0.404 ± 0.085
(− 4.49 %)
0.416 ± 0.040
(− 1.42 %)
0.016
0.022
Phosphates (mg L
-1 ) ± .618 ± 0.106 0.932 ± 0.115
(+ 50.81 %)
1.198 ± 0.299
(+ 93.85 %)
1.498 ± 0.320
(+ 142.39 %)
1.814 ± 0.340
(+ 193.53 %)
2.083 ± 0.279
(+ 237.06 %)
0.157
0.216
Potassium (mg L
-1 ) 13.60 ± 1.10
13.15 ± 1.11
(− 3.31 %)
13.09 ± 1.20
(− 3.75 %)
13.16 ± 1.15
(− 3.24 %)
13.06 ± 1.02
(− 3.97 %)
13.26 ± 1.10
(− 2.50 %)
0.957
1.379
Mean ± SD, within parenthesis percent variation over the control
12 Household Detergents Causing Eutrophication in Freshwater Ecosystems
Excel. There was no statistical difference in potassium level
in all treatments including control (Table 12.10).
12.3.4.3 Growth Responses of Spirodela polyrrhiza
Table 12.11 shows the data on the growth responses of Spirodela polyrrhizatreated in large earthen pots with varying
concentrations of Surf Excel powder. As evident from data the
Spirodela polyrrhiza grown in varying concentrations of Surf
Excel accumulated larger amount of dry matter as compared
to the control. The chlorophyll a and b in the plants treated
with Surf Excel was marginally higher. The chlorophyll a and
b in plant treated with 40 ppm of Surf Excel was relatively
higher than in any other treatment. The nitrogen, phosphorus,
and potash uptake was found related with concentrations of
Surf Excel up to 40 ppm. The uptake of NPK showed consistent increase with the detergent concentration up to 40 ppm
with some exception of nitrogen uptake (Table 12.11).
12.3.4.4 Water Quality
The data summarized in Table 12.12 show the physico–chemical properties of the water sampled from varying concentrations of Surf Excel. The turbidity and pH increased with the
concentration of the detergent used. The dissolved oxygen was
negatively related with the detergent concentration. After the
treatment, the nitrate content in solution with higher detergent
concentrations significantly reduced as compared to control.
The phosphate was found almost directly related with the concentration of Surf Excel. Potassium, however, did not show
any statistical difference in all water samples ranging from 0
to 50 ppm of Surf Excel (Table 12.12).
Table 12.9 Growth response of Lemna minor treated in large earthen pots with varying concentrations of Surf Excel detergent
Parameters
Concentration (ppm)
LSD at
0
10
20
30
40
50
5 %
1 %
Dry weight
(mg/g)
117.2 ± 2.6
119.2 ± 2.1 (+ 1.7 %) 128.1 ± 2.2
(+ 9.3 %)
124.1 ± 1.4
(+ 5.9 %)
122.7 ± 1.3
(+ 4.7 %)
122.0 ± 2.0
(+ 4.1 %)
3.0
4.6
Chlorophyll-a
(mg/g)
0.61 ± 0.04
0.66 ± 0.03 (+ 7.3 %) 0.74 ± 0.05
(+ 19.8 %)
0.62 ± 0.04
(+ 1.1 %)
0.68 ± 0.05
(+ 10.1 %)
0.64 ± 0.08
(+ 4.6 %)
0.04
0.07
Chlorophyll-b
(mg/g)
0.32 ± 0.05
0.36 ± 0.02 (+ 11.2 %) 0.41 ± 0.08
(+ 28.0 %)
0.33 ± 0.03
(+ 2.5 %)
0.37 ± 0.04
(+ 15.3 %)
0.34 ± 0.03
(+ 4.7 %)
0.05
0.08
Chlorophyll
total (mg/g)
1.00 ± 0.04
1.07 ± 0.07 (+ 6.3 %) 1.19 ± 0.09
(+ 18.1 %)
1.04 ± 0.07
(+ 3.6 %)
1.07 ± 0.06
(+ 6.1 %)
1.07 ± 0.07
(+ 6.3 %)
0.06
0.09
Nitrogen
(mg/100 mg)
2.68 ± 0.22
3.18 ± 0.19 (+ 18.7 %) 3.39 ± 0.19
(+ 26.4 %)
3.65 ± 0.25
(+ 36.2 %)
3.22 ± 0.24
(+ 20.2 %)
2.96 ± 0.29
(+ 10.5 %)
0.28
0.56
Phosphorus
(mg/100 mg)
0.30 ± 0.04
0.38 ± 0.05 (+ 27.0 %) 0.41 ± 0.02
(+ 37.3 %)
0.39 ± 0.04
(+ 28.6 %)
0.37 ± 0.03
(+ 24.0 %)
0.37 ± 0.04
(+ 22.6 %)
0.02
0.05
Potassium
(mg/100 mg)
1.73 ± 0.28
1.86 ± 0.28 (+ 7.5 %) 1.76 ± 0.38
(+ 1.7 %)
1.90 ± 0.32
(+ 9.8 %)
2.3 ± 0.33
(+ 33.0 %)
2.10 ± 0.41
(+ 21.4 %)
0.26
0.46
Mean ± SD, within parenthesis percent increase over the control (in rounded figures)
Table 12.10 Physico–chemical characteristics of varying concentrations of Surf Excel detergent solutions including control as estimated after
the experiments with Lemna minor 15 L earthen pots
Parameters
Concentration (ppm)
LSD at
0
10
20
30
40
50
5 %
1 %
Turbidity (NTU)
9 ± 2
11 ± 3
(+ 22.22 %)
14 ± 2
(+ 55.56 %)
16 ± 2
(+ 77.78 %)
18 ± 2
(+ 100 %)
19 ± 3
(+ 111.11 %)
3.2
4.6
pH
7.6 ± 0.1
7.7 ± 0.1
(+ 1.32 %)
7.9 ± 0.2
(+ 3.95 %)
8.1 ± 0.1
(+ 6.58 %)
8.5 ± 0.2
(+ 11.84 %)
8.8 ± 0.2
(+ 15.79 %)
0.3
0.4
Dissolved oxygen
(mg L -1 )
7.45 ± 0.45
7.12 ± 0.27
(− 4.43 %)
6.83 ± 0.28
(− 8.32 %)
5.69 ± 0.41
(− 23.62 %)
6.09 ± 0.26
(− 18.26 %)
5.45 ± 0.30
(− 26.85 %)
0.17
0.24
Nitrates (mg L
-1
)
± .423 ± 0.022 0.407 ± 0.062
(− 3.75 %)
0.399 ± 0.050
(− 5.60 %)
0.38 ± 0.068
(− 9.69 %)
0.404 ± 0.085
(− 4.49 %)
0.416 ± 0.040
(− 1.42 %)
0.016
0.022
Phosphates (mg L
-1 ) ± .618 ± 0.106 0.932 ± 0.115
(+ 50.81 %)
1.198 ± 0.299
(+ 93.85 %)
1.498 ± 0.320
(+ 142.39 %)
1.814 ± 0.340
(+ 193.53 %)
2.083 ± 0.279
(+ 237.06 %)
0.157
0.216
Potassium (mg L
-1 ) 13.60 ± 1.10
13.15 ± 1.11
(− 3.31 %)
13.09 ± 1.20
(− 3.75 %)
13.16 ± 1.15
(− 3.24 %)
13.06 ± 1.02
(− 3.97 %)
13.26 ± 1.10
(− 2.50 %)
0.957
1.379
Mean ± SD, within parenthesis percent variation over the control