

150
12.3.5 Effect of Temperature
12.3.5.1 Sensitivity of Lemna minor
The data on dry weight, chlorophyll content and NPK of
Lemna minor recorded at 11th day of treatment or after their
death (at an early stage in response to high temperatures) are
summarized in Table 12.13. The greater quantity of matter accumulation was noted on treatment with 30 and 40 ppm of
Surf Excel at 20 and 30 °C temperatures. The nitrogen accumulation was optimum at 30 °C in the plants treated with 30
and 40 ppm of Surf Excel. The optimum uptake of phosphorus
was noted on treatment with 50 ppm of Surf Excel at 20 °C
temperature. The most noticeable changes in phosphorus
uptake were recorded in almost all treatments maintained at
20 and 30 °C temperatures. The potassium uptake was also
significantly higher in most of the treatments at 20, 30, and
40 °C. The optimum uptake in potassium was recorded in
plants treated with 40 ppm of Surf Excel at 20 °C temperature
(Table 12.13).
12.3.5.2 Water Quality
The data summarized in the Table 12.14 show the physico–
chemical characteristics of the water samples with varying
concentrations of Surf Excel maintained at five temperature
ranges and studied at 11th day of growth experiments with of
Lemna minor. The pH and turbidity of water shows marginal
but consistent increase with the detergent concentration at
all temperature regimes. The dissolved oxygen reduced significantly in almost all treatments of Surf Excel with respect
to control at 20 and 30 °C temperature. No significant difference in accumulation of nitrates was recorded between all
the treatments. The interaction of temperature and treatment
also did not show any statistical difference. The phosphates
Parameters
Concentration (ppm)
LSD at
0
10
20
30
40
50
5 %
1 %
Dry weight (mg/g) 122.3 ± 1.8
125.9 ± 1.3
(+ 2.9 %)
124.2 ± 2.2
(+ 1.6 %)
125.0 ± 2.4
(+ 2.2 %)
131.5 ± 2.1
(+ 7.5 %)
127.6 ± 2.1
(+ 4.3 %)
2.9
4.2
Chlorophyll-a
(mg/g)
0.63 ± 0.25
0.64 ± 0.23
(+ 0.8 %)
0.64 ± 0.28
(+ 1.4 %)
0.70 ± 0.02
(+ 11.2 %)
0.79 ± 0.01
(+ 24.2 %)
0.72 ± 0.2
(+ 13.9 %)
0.03
0.04
Chlorophyll-b
(mg/g)
0.35 ± 0.01
0.37 ± 0.02
(+ 4.0 %)
0.36 ± 0.02
(+ 3.0 %)
0.38 ± 0.02
(+ 8.3 %)
0.44 ± 0.02
(+ 25.9 %)
0.39 ± 0.02
(+ 12.0 %)
0.02
0.05
Chlorophyll total
(mg/g)
0.99 ± 0.02
1.03 ± 0.02
(+ 3.9 %)
1.02 ± 0.05
(+ 2.9 %)
1.12 ± 0.04
(+ 13.1 %)
1.30 ± 0.04
(+ 31.0 %)
1.12 ± 0.01
(+ 12.18 %)
0.05
0.07
Nitrogen
(mg/100 mg)
3.09 ± 0.15
3.39 ± 0.18
(+ 9.7 %)
4.13 ± 0.19
(+ 33.7 %)
3.69 ± 0.20
(+ 19.4 %)
3.64 ± 0.20
(+ 17.8 %)
3.80 ± 0.17
(+ 23.0 %)
0.13
0.25
Phosphorus
(mg/100 mg)
0.25 ± 0.03
0.34 ± 0.02
(+ 36.7 %)
0.37 ± 0.02
(+ 45.8 %)
0.39 ± 0.02
(+ 53.4 %)
0.40 ± 0.27
(+ 59.8 %)
0.35 ± 0.22
(+ 39.4 %)
0.01
0.03
Potassium
(mg/100 mg)
2.20 ± 0.18
2.24 ± 0.15
(+ 1.8 %)
2.33 ± 0.28
(+ 5.9 %)
2.37 ± 0.17
(+ 7.7 %)
2.70 ± 0.22
(+ 22.7 %)
2.40 ± 0.13
(+ 9.1 %)
0.16
0.23
Mean ± SD, within parenthesis percent increase over the control (in rounded figures)
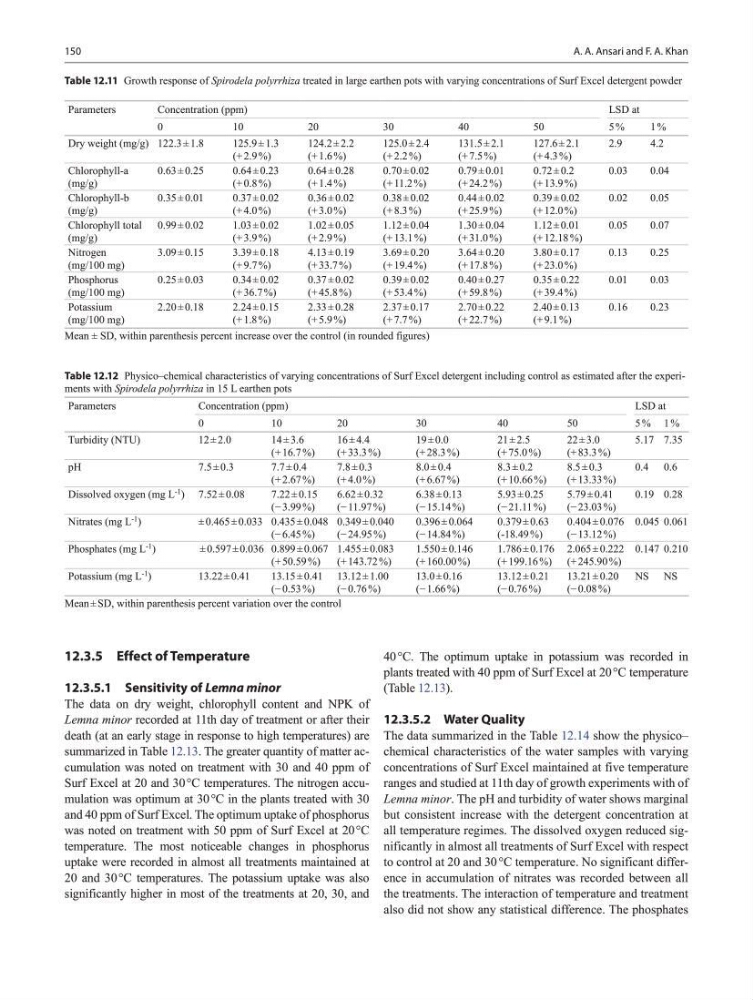
Table 12.11 Growth response of Spirodela polyrrhiza treated in large earthen pots with varying concentrations of Surf Excel detergent powder
Table 12.12 Physico–chemical characteristics of varying concentrations of Surf Excel detergent including control as estimated after the experiments with Spirodela polyrrhiza in 15 L earthen pots
Parameters
Concentration (ppm)
LSD at
0
10
20
30
40
50
5 % 1 %
Turbidity (NTU)
12 ± 2.0
14 ± 3.6
(+ 16.7 %)
16 ± 4.4
(+ 33.3 %)
19 ± 0.0
(+ 28.3 %)
21 ± 2.5
(+ 75.0 %)
22 ± 3.0
(+ 83.3 %)
5.17 7.35
pH
7.5 ± 0.3
7.7 ± 0.4
(+ 2.67 %)
7.8 ± 0.3
(+ 4.0 %)
8.0 ± 0.4
(+ 6.67 %)
8.3 ± 0.2
(+ 10.66 %)
8.5 ± 0.3
(+ 13.33 %)
0.4 0.6
Dissolved oxygen (mg L -1 ) 7.52 ± 0.08
7.22 ± 0.15
(− 3.99 %)
6.62 ± 0.32
(− 11.97 %)
6.38 ± 0.13
(− 15.14 %)
5.93 ± 0.25
(− 21.11 %)
5.79 ± 0.41
(− 23.03 %)
0.19 0.28
Nitrates (mg L
-1 )
± 0.465 ± 0.033 0.435 ± 0.048
(− 6.45 %)
0.349 ± 0.040
(− 24.95 %)
0.396 ± 0.064
(− 14.84 %)
0.379 ± 0.63
(-18.49 %)
0.404 ± 0.076
(− 13.12 %)
0.045 0.061
Phosphates (mg L
-1 )
± 0.597 ± 0.036 0.899 ± 0.067
(+ 50.59 %)
1.455 ± 0.083
(+ 143.72 %)
1.550 ± 0.146
(+ 160.00 %)
1.786 ± 0.176
(+ 199.16 %)
2.065 ± 0.222
(+ 245.90 %)
0.147 0.210
Potassium (mg L
-1
)
13.22 ± 0.41
13.15 ± 0.41
(− 0.53 %)
13.12 ± 1.00
(− 0.76 %)
13.0 ± 0.16
(− 1.66 %)
13.12 ± 0.21
(− 0.76 %)
13.21 ± 0.20
(− 0.08 %)
NS NS
Mean ± SD, within parenthesis percent variation over the control
A. A. Ansari and F. A. Khan
12.3.5 Effect of Temperature
12.3.5.1 Sensitivity of Lemna minor
The data on dry weight, chlorophyll content and NPK of
Lemna minor recorded at 11th day of treatment or after their
death (at an early stage in response to high temperatures) are
summarized in Table 12.13. The greater quantity of matter accumulation was noted on treatment with 30 and 40 ppm of
Surf Excel at 20 and 30 °C temperatures. The nitrogen accumulation was optimum at 30 °C in the plants treated with 30
and 40 ppm of Surf Excel. The optimum uptake of phosphorus
was noted on treatment with 50 ppm of Surf Excel at 20 °C
temperature. The most noticeable changes in phosphorus
uptake were recorded in almost all treatments maintained at
20 and 30 °C temperatures. The potassium uptake was also
significantly higher in most of the treatments at 20, 30, and
40 °C. The optimum uptake in potassium was recorded in
plants treated with 40 ppm of Surf Excel at 20 °C temperature
(Table 12.13).
12.3.5.2 Water Quality
The data summarized in the Table 12.14 show the physico–
chemical characteristics of the water samples with varying
concentrations of Surf Excel maintained at five temperature
ranges and studied at 11th day of growth experiments with of
Lemna minor. The pH and turbidity of water shows marginal
but consistent increase with the detergent concentration at
all temperature regimes. The dissolved oxygen reduced significantly in almost all treatments of Surf Excel with respect
to control at 20 and 30 °C temperature. No significant difference in accumulation of nitrates was recorded between all
the treatments. The interaction of temperature and treatment
also did not show any statistical difference. The phosphates
Parameters
Concentration (ppm)
LSD at
0
10
20
30
40
50
5 %
1 %
Dry weight (mg/g) 122.3 ± 1.8
125.9 ± 1.3
(+ 2.9 %)
124.2 ± 2.2
(+ 1.6 %)
125.0 ± 2.4
(+ 2.2 %)
131.5 ± 2.1
(+ 7.5 %)
127.6 ± 2.1
(+ 4.3 %)
2.9
4.2
Chlorophyll-a
(mg/g)
0.63 ± 0.25
0.64 ± 0.23
(+ 0.8 %)
0.64 ± 0.28
(+ 1.4 %)
0.70 ± 0.02
(+ 11.2 %)
0.79 ± 0.01
(+ 24.2 %)
0.72 ± 0.2
(+ 13.9 %)
0.03
0.04
Chlorophyll-b
(mg/g)
0.35 ± 0.01
0.37 ± 0.02
(+ 4.0 %)
0.36 ± 0.02
(+ 3.0 %)
0.38 ± 0.02
(+ 8.3 %)
0.44 ± 0.02
(+ 25.9 %)
0.39 ± 0.02
(+ 12.0 %)
0.02
0.05
Chlorophyll total
(mg/g)
0.99 ± 0.02
1.03 ± 0.02
(+ 3.9 %)
1.02 ± 0.05
(+ 2.9 %)
1.12 ± 0.04
(+ 13.1 %)
1.30 ± 0.04
(+ 31.0 %)
1.12 ± 0.01
(+ 12.18 %)
0.05
0.07
Nitrogen
(mg/100 mg)
3.09 ± 0.15
3.39 ± 0.18
(+ 9.7 %)
4.13 ± 0.19
(+ 33.7 %)
3.69 ± 0.20
(+ 19.4 %)
3.64 ± 0.20
(+ 17.8 %)
3.80 ± 0.17
(+ 23.0 %)
0.13
0.25
Phosphorus
(mg/100 mg)
0.25 ± 0.03
0.34 ± 0.02
(+ 36.7 %)
0.37 ± 0.02
(+ 45.8 %)
0.39 ± 0.02
(+ 53.4 %)
0.40 ± 0.27
(+ 59.8 %)
0.35 ± 0.22
(+ 39.4 %)
0.01
0.03
Potassium
(mg/100 mg)
2.20 ± 0.18
2.24 ± 0.15
(+ 1.8 %)
2.33 ± 0.28
(+ 5.9 %)
2.37 ± 0.17
(+ 7.7 %)
2.70 ± 0.22
(+ 22.7 %)
2.40 ± 0.13
(+ 9.1 %)
0.16
0.23
Mean ± SD, within parenthesis percent increase over the control (in rounded figures)
Table 12.11 Growth response of Spirodela polyrrhiza treated in large earthen pots with varying concentrations of Surf Excel detergent powder
Table 12.12 Physico–chemical characteristics of varying concentrations of Surf Excel detergent including control as estimated after the experiments with Spirodela polyrrhiza in 15 L earthen pots
Parameters
Concentration (ppm)
LSD at
0
10
20
30
40
50
5 % 1 %
Turbidity (NTU)
12 ± 2.0
14 ± 3.6
(+ 16.7 %)
16 ± 4.4
(+ 33.3 %)
19 ± 0.0
(+ 28.3 %)
21 ± 2.5
(+ 75.0 %)
22 ± 3.0
(+ 83.3 %)
5.17 7.35
pH
7.5 ± 0.3
7.7 ± 0.4
(+ 2.67 %)
7.8 ± 0.3
(+ 4.0 %)
8.0 ± 0.4
(+ 6.67 %)
8.3 ± 0.2
(+ 10.66 %)
8.5 ± 0.3
(+ 13.33 %)
0.4 0.6
Dissolved oxygen (mg L -1 ) 7.52 ± 0.08
7.22 ± 0.15
(− 3.99 %)
6.62 ± 0.32
(− 11.97 %)
6.38 ± 0.13
(− 15.14 %)
5.93 ± 0.25
(− 21.11 %)
5.79 ± 0.41
(− 23.03 %)
0.19 0.28
Nitrates (mg L
-1 )
± 0.465 ± 0.033 0.435 ± 0.048
(− 6.45 %)
0.349 ± 0.040
(− 24.95 %)
0.396 ± 0.064
(− 14.84 %)
0.379 ± 0.63
(-18.49 %)
0.404 ± 0.076
(− 13.12 %)
0.045 0.061
Phosphates (mg L
-1 )
± 0.597 ± 0.036 0.899 ± 0.067
(+ 50.59 %)
1.455 ± 0.083
(+ 143.72 %)
1.550 ± 0.146
(+ 160.00 %)
1.786 ± 0.176
(+ 199.16 %)
2.065 ± 0.222
(+ 245.90 %)
0.147 0.210
Potassium (mg L
-1
)
13.22 ± 0.41
13.15 ± 0.41
(− 0.53 %)
13.12 ± 1.00
(− 0.76 %)
13.0 ± 0.16
(− 1.66 %)
13.12 ± 0.21
(− 0.76 %)
13.21 ± 0.20
(− 0.08 %)
NS NS
Mean ± SD, within parenthesis percent variation over the control
A. A. Ansari and F. A. Khan