

10 Seasonal and Spatial Nutrient Dynamics in Saronikos Gulf: The Impact of Sewage Effluents …
125
Taking into account the whole water column and the
annual mean values, station S7 is characterized as higher
mesotrophic for SRP before and after the operation of the
sewage treatment, whereas interesting changes of the trophic
characterization for nitrate and ammonium were observed.
It seems that after the operation of the primary sewage treatment the marine environment in the vicinity of the sewage
outfall became more eutrophic, as it received a great amount
of effluents for the first time. After the operation of the secondary sewage treatment, a shift to a better trophic status
was achieved for nitrate and ammonium. However, higher
mesotrophic conditions for SRP indicate a sensitive marine
area, as it can be eutrophic in the future (Pagou 2005). It
seems that this is not the case for S7 station as a decreasing
trend for SRP after 2005 has been detected (Fig. 10.8).
Taking into account the whole water column and the
annual mean values of nutrients and chlorophyll-a for the
period 2009–2010, station S7 is characterized as higher
mesotrophic for SRP, nitrate, and ammonium and lower
mesotrophic for chlorophyll-a. Station S11, which is located 7.4 km southeast of the Psittalia outfall, is characterized
as oligotrophic for SRP, nitrate, and ammonium and lower
mesotrophic for chlorophyll-a. Station S8, which is located
almost at the same distance (~ 7 km) southwest of the Psittalia outfall, seems to be a more eutrophic station, as it is characterized as lower mesotrophic for SRP and chlorophyll-a,
Table 10.4 Mean integrated nutrient concentrations and their ratios for the water column before and after preliminary and secondary sewage
treatment at different stations of the Inner Saronikos Gulf located at the sewage discharge (S7) and in a distance southwest (S8, S13) and southeast
(S11, S16) from Psittalia. All nutrient concentrations are expressed in μM
PO 4
SiO 4
NO 2
NO 3
NH 4
DIN:P
Si:P
DIN
Si:DIN
Si:NO 3
S7
1987–1994
0.243
1.228
0.250
0.605
0.755
8.664
8.041
1.562
0.934
2.611
1995–2004
0.390
1.951
0.295
0.867
1.328
7.025
6.623
2.371
1.033
2.821
2005–2010
0.202
1.739
0.205
0.583
0.997
9.333
13.13
1.784
1.541
4.111
S16
1987–1994
0.107
1.023
0.160
0.382
0.354
9.613
12.56
0.849
1.451
3.806
1995–2004
0.129
1.657
0.172
0.536
0.312
11.03
18.56
1.006
2.028
4.904
2005–2010
0.075
1.398
0.090
0.355
0.261
12.65
32.89
0.706
2.794
8.533
S11
1987–1994
0.122
1.013
0.194
0.491
0.440
9.968
10.30
1.092
1.090
3.249
1995–2004
0.201
1.813
0.256
0.835
0.441
10.22
12.01
1.460
1.382
2.627
2005–2010
0.112
1.535
0.136
0.516
0.307
10.50
21.68
0.920
2.135
5.101
S13
1987–1994
0.114
1.367
0.197
0.697
0.440
11.11
13.63
1.167
1.411
2.125
1995–2004
0.197
1.895
0.234
1.084
0.441
10.11
11.46
1.680
1.365
2.119
2005–2010
0.108
1.721
0.114
0.734
0.307
12.55
20.91
1.171
1.748
4.129
S8
1998–2004
0.249
2.009
0.250
1.127
0.256
7.771
9.574
1.623
1.330
1.955
2005–2010
0.157
1.734
0.156
1.007
0.333
10.50
13.22
1.496
1.374
3.590
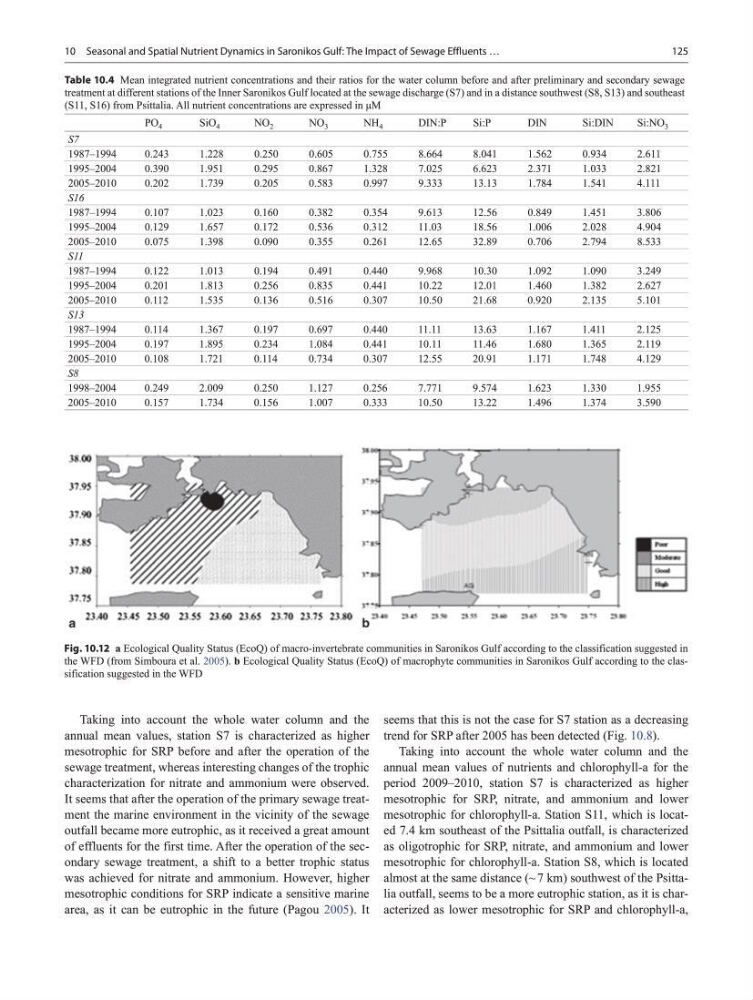
Fig. 10.12 a Ecological Quality Status (EcoQ) of macro-invertebrate communities in Saronikos Gulf according to the classification suggested in
the WFD (from Simboura et al. 2005). b Ecological Quality Status (EcoQ) of macrophyte communities in Saronikos Gulf according to the classification suggested in the WFD
125
Taking into account the whole water column and the
annual mean values, station S7 is characterized as higher
mesotrophic for SRP before and after the operation of the
sewage treatment, whereas interesting changes of the trophic
characterization for nitrate and ammonium were observed.
It seems that after the operation of the primary sewage treatment the marine environment in the vicinity of the sewage
outfall became more eutrophic, as it received a great amount
of effluents for the first time. After the operation of the secondary sewage treatment, a shift to a better trophic status
was achieved for nitrate and ammonium. However, higher
mesotrophic conditions for SRP indicate a sensitive marine
area, as it can be eutrophic in the future (Pagou 2005). It
seems that this is not the case for S7 station as a decreasing
trend for SRP after 2005 has been detected (Fig. 10.8).
Taking into account the whole water column and the
annual mean values of nutrients and chlorophyll-a for the
period 2009–2010, station S7 is characterized as higher
mesotrophic for SRP, nitrate, and ammonium and lower
mesotrophic for chlorophyll-a. Station S11, which is located 7.4 km southeast of the Psittalia outfall, is characterized
as oligotrophic for SRP, nitrate, and ammonium and lower
mesotrophic for chlorophyll-a. Station S8, which is located
almost at the same distance (~ 7 km) southwest of the Psittalia outfall, seems to be a more eutrophic station, as it is characterized as lower mesotrophic for SRP and chlorophyll-a,
Table 10.4 Mean integrated nutrient concentrations and their ratios for the water column before and after preliminary and secondary sewage
treatment at different stations of the Inner Saronikos Gulf located at the sewage discharge (S7) and in a distance southwest (S8, S13) and southeast
(S11, S16) from Psittalia. All nutrient concentrations are expressed in μM
PO 4
SiO 4
NO 2
NO 3
NH 4
DIN:P
Si:P
DIN
Si:DIN
Si:NO 3
S7
1987–1994
0.243
1.228
0.250
0.605
0.755
8.664
8.041
1.562
0.934
2.611
1995–2004
0.390
1.951
0.295
0.867
1.328
7.025
6.623
2.371
1.033
2.821
2005–2010
0.202
1.739
0.205
0.583
0.997
9.333
13.13
1.784
1.541
4.111
S16
1987–1994
0.107
1.023
0.160
0.382
0.354
9.613
12.56
0.849
1.451
3.806
1995–2004
0.129
1.657
0.172
0.536
0.312
11.03
18.56
1.006
2.028
4.904
2005–2010
0.075
1.398
0.090
0.355
0.261
12.65
32.89
0.706
2.794
8.533
S11
1987–1994
0.122
1.013
0.194
0.491
0.440
9.968
10.30
1.092
1.090
3.249
1995–2004
0.201
1.813
0.256
0.835
0.441
10.22
12.01
1.460
1.382
2.627
2005–2010
0.112
1.535
0.136
0.516
0.307
10.50
21.68
0.920
2.135
5.101
S13
1987–1994
0.114
1.367
0.197
0.697
0.440
11.11
13.63
1.167
1.411
2.125
1995–2004
0.197
1.895
0.234
1.084
0.441
10.11
11.46
1.680
1.365
2.119
2005–2010
0.108
1.721
0.114
0.734
0.307
12.55
20.91
1.171
1.748
4.129
S8
1998–2004
0.249
2.009
0.250
1.127
0.256
7.771
9.574
1.623
1.330
1.955
2005–2010
0.157
1.734
0.156
1.007
0.333
10.50
13.22
1.496
1.374
3.590
Fig. 10.12 a Ecological Quality Status (EcoQ) of macro-invertebrate communities in Saronikos Gulf according to the classification suggested in
the WFD (from Simboura et al. 2005). b Ecological Quality Status (EcoQ) of macrophyte communities in Saronikos Gulf according to the classification suggested in the WFD