

A. Pavlidou et al.
126
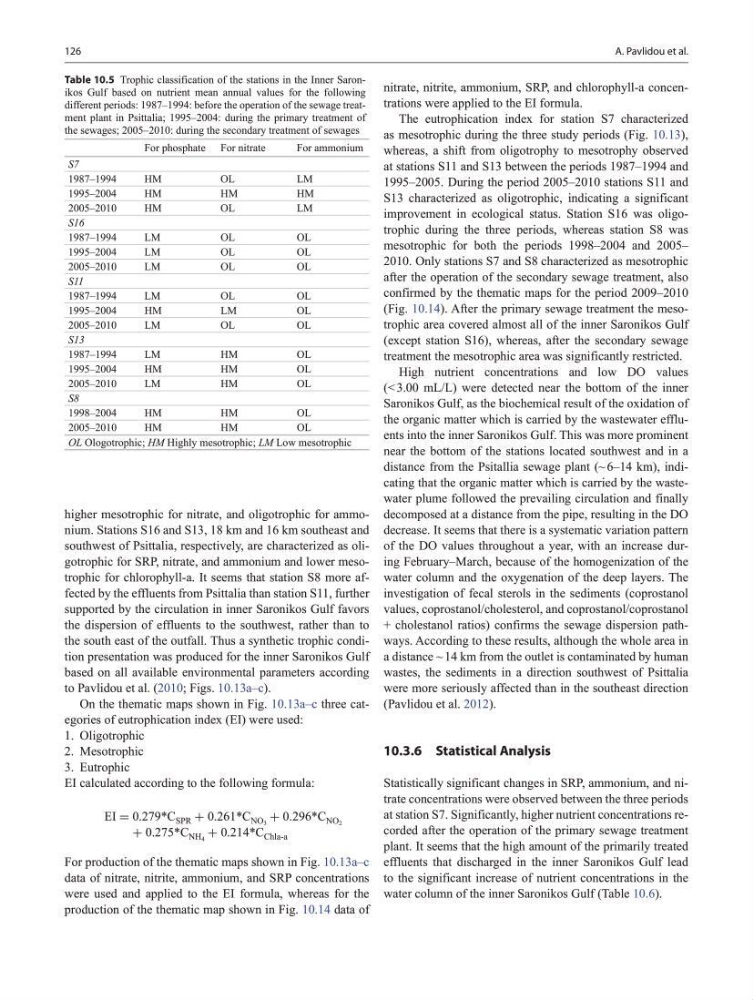
higher mesotrophic for nitrate, and oligotrophic for ammonium. Stations S16 and S13, 18 km and 16 km southeast and
southwest of Psittalia, respectively, are characterized as oligotrophic for SRP, nitrate, and ammonium and lower mesotrophic for chlorophyll-a. It seems that station S8 more affected by the effluents from Psittalia than station S11, further
supported by the circulation in inner Saronikos Gulf favors
the dispersion of effluents to the southwest, rather than to
the south east of the outfall. Thus a synthetic trophic condition presentation was produced for the inner Saronikos Gulf
based on all available environmental parameters according
to Pavlidou et al. (2010; Figs. 10.13a–c).
On the thematic maps shown in Fig. 10.13a–c three categories of eutrophication index (EI) were used:
1. Oligotrophic
2. Mesotrophic
3. Eutrophic
EI calculated according to the following formula:
For production of the thematic maps shown in Fig. 10.13a–c
data of nitrate, nitrite, ammonium, and SRP concentrations
were used and applied to the EI formula, whereas for the
production of the thematic map shown in Fig. 10.14 data of
EI = 0.279*C SPR + 0.261*C NO 3 + 0.296*C NO 2
+ 0.275*C NH 4 + 0.214*C Chla-a
Table 10.5 Trophic classification of the stations in the Inner Saronikos Gulf based on nutrient mean annual values for the following
different periods: 1987–1994: before the operation of the sewage treatment plant in Psittalia; 1995–2004: during the primary treatment of
the sewages; 2005–2010: during the secondary treatment of sewages
For phosphate For nitrate
For ammonium
S7
1987–1994
HM
OL
LM
1995–2004
HM
HM
HM
2005–2010
HM
OL
LM
S16
1987–1994
LM
OL
OL
1995–2004
LM
OL
OL
2005–2010
LM
OL
OL
S11
1987–1994
LM
OL
OL
1995–2004
HM
LM
OL
2005–2010
LM
OL
OL
S13
1987–1994
LM
HM
OL
1995–2004
HM
HM
OL
2005–2010
LM
HM
OL
S8
1998–2004
HM
HM
OL
2005–2010
HM
HM
OL
OL Ologotrophic; HM Highly mesotrophic; LM Low mesotrophic
nitrate, nitrite, ammonium, SRP, and chlorophyll-a concentrations were applied to the EI formula.
The eutrophication index for station S7 characterized
as mesotrophic during the three study periods (Fig. 10.13),
whereas, a shift from oligotrophy to mesotrophy observed
at stations S11 and S13 between the periods 1987–1994 and
1995–2005. During the period 2005–2010 stations S11 and
S13 characterized as oligotrophic, indicating a significant
improvement in ecological status. Station S16 was oligotrophic during the three periods, whereas station S8 was
mesotrophic for both the periods 1998–2004 and 2005–
2010. Only stations S7 and S8 characterized as mesotrophic
after the operation of the secondary sewage treatment, also
confirmed by the thematic maps for the period 2009–2010
(Fig. 10.14). After the primary sewage treatment the mesotrophic area covered almost all of the inner Saronikos Gulf
(except station S16), whereas, after the secondary sewage
treatment the mesotrophic area was significantly restricted.
High nutrient concentrations and low DO values
(< 3.00 mL/L) were detected near the bottom of the inner
Saronikos Gulf, as the biochemical result of the oxidation of
the organic matter which is carried by the wastewater effluents into the inner Saronikos Gulf. This was more prominent
near the bottom of the stations located southwest and in a
distance from the Psitallia sewage plant (~ 6–14 km), indicating that the organic matter which is carried by the wastewater plume followed the prevailing circulation and finally
decomposed at a distance from the pipe, resulting in the DO
decrease. It seems that there is a systematic variation pattern
of the DO values throughout a year, with an increase during February–March, because of the homogenization of the
water column and the oxygenation of the deep layers. The
investigation of fecal sterols in the sediments (coprostanol
values, coprostanol/cholesterol, and coprostanol/coprostanol
+ cholestanol ratios) confirms the sewage dispersion pathways. According to these results, although the whole area in
a distance ~ 14 km from the outlet is contaminated by human
wastes, the sediments in a direction southwest of Psittalia
were more seriously affected than in the southeast direction
(Pavlidou et al. 2012).
10.3.6 Statistical Analysis
Statistically significant changes in SRP, ammonium, and nitrate concentrations were observed between the three periods
at station S7. Significantly, higher nutrient concentrations recorded after the operation of the primary sewage treatment
plant. It seems that the high amount of the primarily treated
effluents that discharged in the inner Saronikos Gulf lead
to the significant increase of nutrient concentrations in the
water column of the inner Saronikos Gulf (Table 10.6).
126
higher mesotrophic for nitrate, and oligotrophic for ammonium. Stations S16 and S13, 18 km and 16 km southeast and
southwest of Psittalia, respectively, are characterized as oligotrophic for SRP, nitrate, and ammonium and lower mesotrophic for chlorophyll-a. It seems that station S8 more affected by the effluents from Psittalia than station S11, further
supported by the circulation in inner Saronikos Gulf favors
the dispersion of effluents to the southwest, rather than to
the south east of the outfall. Thus a synthetic trophic condition presentation was produced for the inner Saronikos Gulf
based on all available environmental parameters according
to Pavlidou et al. (2010; Figs. 10.13a–c).
On the thematic maps shown in Fig. 10.13a–c three categories of eutrophication index (EI) were used:
1. Oligotrophic
2. Mesotrophic
3. Eutrophic
EI calculated according to the following formula:
For production of the thematic maps shown in Fig. 10.13a–c
data of nitrate, nitrite, ammonium, and SRP concentrations
were used and applied to the EI formula, whereas for the
production of the thematic map shown in Fig. 10.14 data of
EI = 0.279*C SPR + 0.261*C NO 3 + 0.296*C NO 2
+ 0.275*C NH 4 + 0.214*C Chla-a
Table 10.5 Trophic classification of the stations in the Inner Saronikos Gulf based on nutrient mean annual values for the following
different periods: 1987–1994: before the operation of the sewage treatment plant in Psittalia; 1995–2004: during the primary treatment of
the sewages; 2005–2010: during the secondary treatment of sewages
For phosphate For nitrate
For ammonium
S7
1987–1994
HM
OL
LM
1995–2004
HM
HM
HM
2005–2010
HM
OL
LM
S16
1987–1994
LM
OL
OL
1995–2004
LM
OL
OL
2005–2010
LM
OL
OL
S11
1987–1994
LM
OL
OL
1995–2004
HM
LM
OL
2005–2010
LM
OL
OL
S13
1987–1994
LM
HM
OL
1995–2004
HM
HM
OL
2005–2010
LM
HM
OL
S8
1998–2004
HM
HM
OL
2005–2010
HM
HM
OL
OL Ologotrophic; HM Highly mesotrophic; LM Low mesotrophic
nitrate, nitrite, ammonium, SRP, and chlorophyll-a concentrations were applied to the EI formula.
The eutrophication index for station S7 characterized
as mesotrophic during the three study periods (Fig. 10.13),
whereas, a shift from oligotrophy to mesotrophy observed
at stations S11 and S13 between the periods 1987–1994 and
1995–2005. During the period 2005–2010 stations S11 and
S13 characterized as oligotrophic, indicating a significant
improvement in ecological status. Station S16 was oligotrophic during the three periods, whereas station S8 was
mesotrophic for both the periods 1998–2004 and 2005–
2010. Only stations S7 and S8 characterized as mesotrophic
after the operation of the secondary sewage treatment, also
confirmed by the thematic maps for the period 2009–2010
(Fig. 10.14). After the primary sewage treatment the mesotrophic area covered almost all of the inner Saronikos Gulf
(except station S16), whereas, after the secondary sewage
treatment the mesotrophic area was significantly restricted.
High nutrient concentrations and low DO values
(< 3.00 mL/L) were detected near the bottom of the inner
Saronikos Gulf, as the biochemical result of the oxidation of
the organic matter which is carried by the wastewater effluents into the inner Saronikos Gulf. This was more prominent
near the bottom of the stations located southwest and in a
distance from the Psitallia sewage plant (~ 6–14 km), indicating that the organic matter which is carried by the wastewater plume followed the prevailing circulation and finally
decomposed at a distance from the pipe, resulting in the DO
decrease. It seems that there is a systematic variation pattern
of the DO values throughout a year, with an increase during February–March, because of the homogenization of the
water column and the oxygenation of the deep layers. The
investigation of fecal sterols in the sediments (coprostanol
values, coprostanol/cholesterol, and coprostanol/coprostanol
+ cholestanol ratios) confirms the sewage dispersion pathways. According to these results, although the whole area in
a distance ~ 14 km from the outlet is contaminated by human
wastes, the sediments in a direction southwest of Psittalia
were more seriously affected than in the southeast direction
(Pavlidou et al. 2012).
10.3.6 Statistical Analysis
Statistically significant changes in SRP, ammonium, and nitrate concentrations were observed between the three periods
at station S7. Significantly, higher nutrient concentrations recorded after the operation of the primary sewage treatment
plant. It seems that the high amount of the primarily treated
effluents that discharged in the inner Saronikos Gulf lead
to the significant increase of nutrient concentrations in the
water column of the inner Saronikos Gulf (Table 10.6).