

A. Pavlidou et al.
124
with concentrations 0.14–0.68 μM for SRP; 0.65–1.09 μM
for nitrate and 1.05–2.2 μM for ammonium and eutrophic,
with concentrations higher than 0.68 μM for SRP; 1.19 for
nitrate and 2.20 for ammonium. Additionally, the ecological scale for the period 2009–2010 was applied to the inner
Saronikos Gulf based on nutrient and chlorophyll-values.
According to Karydis (1999) the area is characterized as:
oligotrophic, with chl-a concentration < 0.1 μg/L; lower
mesotrophic, with concentrations between 0.1 and 0.6 μg/L;
higher mesotrophic, with concentrations 0.6–2.21 μg/L and
eutrophic, with concentrations higher than 2.21 μg/L.
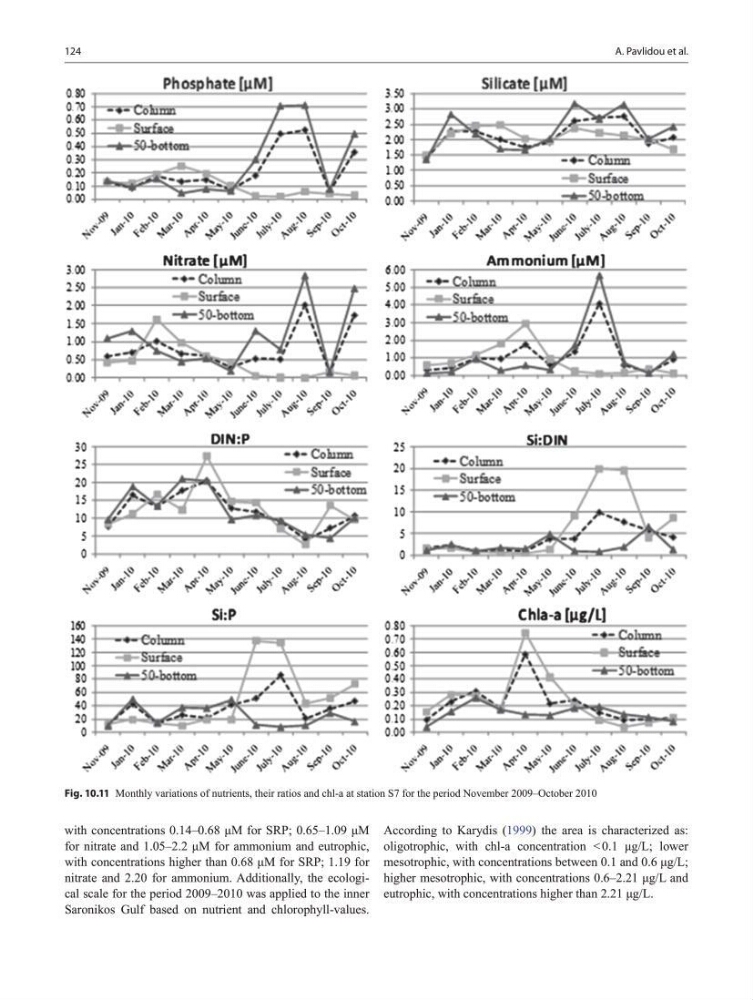
Fig. 10.11 Monthly variations of nutrients, their ratios and chl-a at station S7 for the period November 2009–October 2010
124
with concentrations 0.14–0.68 μM for SRP; 0.65–1.09 μM
for nitrate and 1.05–2.2 μM for ammonium and eutrophic,
with concentrations higher than 0.68 μM for SRP; 1.19 for
nitrate and 2.20 for ammonium. Additionally, the ecological scale for the period 2009–2010 was applied to the inner
Saronikos Gulf based on nutrient and chlorophyll-values.
According to Karydis (1999) the area is characterized as:
oligotrophic, with chl-a concentration < 0.1 μg/L; lower
mesotrophic, with concentrations between 0.1 and 0.6 μg/L;
higher mesotrophic, with concentrations 0.6–2.21 μg/L and
eutrophic, with concentrations higher than 2.21 μg/L.
Fig. 10.11 Monthly variations of nutrients, their ratios and chl-a at station S7 for the period November 2009–October 2010