

10 Seasonal and Spatial Nutrient Dynamics in Saronikos Gulf: The Impact of Sewage Effluents …
123
the case of the inner Saronikοs Gulf since the Si:DIN ratio is
higher than the theoretical one. Yet the DIN:SRP and Si:SRP
ratios at station S7 were significantly reduced, which may
lead to increased blooms in the future.
Monthly data of nutrients and their ratios as well as
of chlorophyll-a for station S7 for the period November
2009–October 2010 showed significant temporal variations
(Fig. 10.11). During this period N-limitation was probable
(58 %), whereas Si-limitation and P-limitation were calculated at 24 % and 18 %, respectively. Significant variation in
nutrient ratios observed during 2009–2010. In winter 47 %
N-limitation was observed, whereas there were equal percentages of P-limitation (27 %) and Si-limitation (27 %). In
spring a shift from N-limitation (30 %) to P-limitation (40 %)
was observed, whereas in summer and autumn N-limitation
was probable as it was calculated to be 75 % in both seasons. A peak of nutrient concentrations occurred in summer.
Phytoplankton data at station S7 for the period 2009–2010
indicated that diatoms were the predominant phytoplankton
group, and the potentially toxic diatom Pseudo-nitzschia was
present during the year (up to 30,080 cells/L) (Pagou et al.
2011). The decreased concentrations of silicate during spring
(higher percentage of Si-limitation) probably reflected the
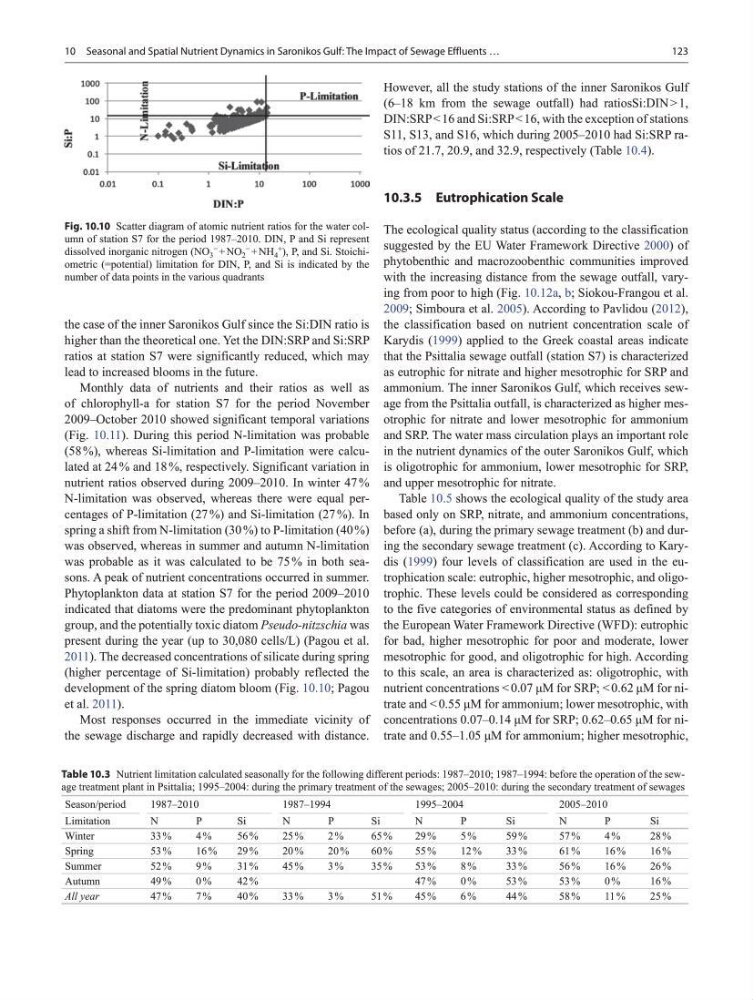
development of the spring diatom bloom (Fig. 10.10; Pagou
et al. 2011).
Most responses occurred in the immediate vicinity of
the sewage discharge and rapidly decreased with distance.
However, all the study stations οf the inner Saronikos Gulf
(6–18 km from the sewage outfall) had ratiosSi:DIN > 1,
DIN:SRP < 16 and Si:SRP < 16, with the exception of stations
S11, S13, and S16, which during 2005–2010 had Si:SRP ratios of 21.7, 20.9, and 32.9, respectively (Table 10.4).
10.3.5 Eutrophication Scale
The ecological quality status (according to the classification
suggested by the EU Water Framework Directive 2000) of
phytobenthic and macrozoobenthic communities improved
with the increasing distance from the sewage outfall, varying from poor to high (Fig. 10.12a, b; Siokou-Frangou et al.
2009; Simboura et al. 2005). According to Pavlidou (2012),
the classification based on nutrient concentration scale of
Karydis (1999) applied to the Greek coastal areas indicate
that the Psittalia sewage outfall (station S7) is characterized
as eutrophic for nitrate and higher mesotrophic for SRP and
ammonium. The inner Saronikos Gulf, which receives sewage from the Psittalia outfall, is characterized as higher mesotrophic for nitrate and lower mesotrophic for ammonium
and SRP. The water mass circulation plays an important role
in the nutrient dynamics of the outer Saronikos Gulf, which
is oligotrophic for ammonium, lower mesotrophic for SRP,
and upper mesotrophic for nitrate.
Table 10.5 shows the ecological quality of the study area
based only on SRP, nitrate, and ammonium concentrations,
before (a), during the primary sewage treatment (b) and during the secondary sewage treatment (c). According to Karydis (1999) four levels of classification are used in the eutrophication scale: eutrophic, higher mesotrophic, and oligotrophic. These levels could be considered as corresponding
to the five categories of environmental status as defined by
the European Water Framework Directive (WFD): eutrophic
for bad, higher mesotrophic for poor and moderate, lower
mesotrophic for good, and oligotrophic for high. According
to this scale, an area is characterized as: oligotrophic, with
nutrient concentrations < 0.07 μΜ for SRP; < 0.62 μM for nitrate and < 0.55 μM for ammonium; lower mesotrophic, with
concentrations 0.07–0.14 μM for SRP; 0.62–0.65 μM for nitrate and 0.55–1.05 μM for ammonium; higher mesotrophic,
Table 10.3 Nutrient limitation calculated seasonally for the following different periods: 1987–2010; 1987–1994: before the operation of the sewage treatment plant in Psittalia; 1995–2004: during the primary treatment of the sewages; 2005–2010: during the secondary treatment of sewages
Season/period
1987–2010
1987–1994
1995–2004
2005–2010
Limitation
N
P
Si
N
P
Si
N
P
Si
N
P
Si
Winter
33 %
4 %
56 %
25 %
2 %
65 %
29 %
5 %
59 %
57 %
4 %
28 %
Spring
53 %
16 %
29 %
20 %
20 %
60 %
55 %
12 %
33 %
61 %
16 %
16 %
Summer
52 %
9 %
31 %
45 %
3 %
35 %
53 %
8 %
33 %
56 %
16 %
26 %
Autumn
49 %
0 %
42 %
47 %
0 %
53 %
53 %
0 %
16 %
All year
47 %
7 %
40 %
33 %
3 %
51 %
45 %
6 %
44 %
58 %
11 %
25 %
Fig. 10.10 Scatter diagram of atomic nutrient ratios for the water column of station S7 for the period 1987–2010. DIN, P and Si represent
dissolved inorganic nitrogen (NO 3
− + NO 2
− + NH 4
+ ), P, and Si. Stoichiometric (=potential) limitation for DIN, P, and Si is indicated by the
number of data points in the various quadrants
123
the case of the inner Saronikοs Gulf since the Si:DIN ratio is
higher than the theoretical one. Yet the DIN:SRP and Si:SRP
ratios at station S7 were significantly reduced, which may
lead to increased blooms in the future.
Monthly data of nutrients and their ratios as well as
of chlorophyll-a for station S7 for the period November
2009–October 2010 showed significant temporal variations
(Fig. 10.11). During this period N-limitation was probable
(58 %), whereas Si-limitation and P-limitation were calculated at 24 % and 18 %, respectively. Significant variation in
nutrient ratios observed during 2009–2010. In winter 47 %
N-limitation was observed, whereas there were equal percentages of P-limitation (27 %) and Si-limitation (27 %). In
spring a shift from N-limitation (30 %) to P-limitation (40 %)
was observed, whereas in summer and autumn N-limitation
was probable as it was calculated to be 75 % in both seasons. A peak of nutrient concentrations occurred in summer.
Phytoplankton data at station S7 for the period 2009–2010
indicated that diatoms were the predominant phytoplankton
group, and the potentially toxic diatom Pseudo-nitzschia was
present during the year (up to 30,080 cells/L) (Pagou et al.
2011). The decreased concentrations of silicate during spring
(higher percentage of Si-limitation) probably reflected the
development of the spring diatom bloom (Fig. 10.10; Pagou
et al. 2011).
Most responses occurred in the immediate vicinity of
the sewage discharge and rapidly decreased with distance.
However, all the study stations οf the inner Saronikos Gulf
(6–18 km from the sewage outfall) had ratiosSi:DIN > 1,
DIN:SRP < 16 and Si:SRP < 16, with the exception of stations
S11, S13, and S16, which during 2005–2010 had Si:SRP ratios of 21.7, 20.9, and 32.9, respectively (Table 10.4).
10.3.5 Eutrophication Scale
The ecological quality status (according to the classification
suggested by the EU Water Framework Directive 2000) of
phytobenthic and macrozoobenthic communities improved
with the increasing distance from the sewage outfall, varying from poor to high (Fig. 10.12a, b; Siokou-Frangou et al.
2009; Simboura et al. 2005). According to Pavlidou (2012),
the classification based on nutrient concentration scale of
Karydis (1999) applied to the Greek coastal areas indicate
that the Psittalia sewage outfall (station S7) is characterized
as eutrophic for nitrate and higher mesotrophic for SRP and
ammonium. The inner Saronikos Gulf, which receives sewage from the Psittalia outfall, is characterized as higher mesotrophic for nitrate and lower mesotrophic for ammonium
and SRP. The water mass circulation plays an important role
in the nutrient dynamics of the outer Saronikos Gulf, which
is oligotrophic for ammonium, lower mesotrophic for SRP,
and upper mesotrophic for nitrate.
Table 10.5 shows the ecological quality of the study area
based only on SRP, nitrate, and ammonium concentrations,
before (a), during the primary sewage treatment (b) and during the secondary sewage treatment (c). According to Karydis (1999) four levels of classification are used in the eutrophication scale: eutrophic, higher mesotrophic, and oligotrophic. These levels could be considered as corresponding
to the five categories of environmental status as defined by
the European Water Framework Directive (WFD): eutrophic
for bad, higher mesotrophic for poor and moderate, lower
mesotrophic for good, and oligotrophic for high. According
to this scale, an area is characterized as: oligotrophic, with
nutrient concentrations < 0.07 μΜ for SRP; < 0.62 μM for nitrate and < 0.55 μM for ammonium; lower mesotrophic, with
concentrations 0.07–0.14 μM for SRP; 0.62–0.65 μM for nitrate and 0.55–1.05 μM for ammonium; higher mesotrophic,
Table 10.3 Nutrient limitation calculated seasonally for the following different periods: 1987–2010; 1987–1994: before the operation of the sewage treatment plant in Psittalia; 1995–2004: during the primary treatment of the sewages; 2005–2010: during the secondary treatment of sewages
Season/period
1987–2010
1987–1994
1995–2004
2005–2010
Limitation
N
P
Si
N
P
Si
N
P
Si
N
P
Si
Winter
33 %
4 %
56 %
25 %
2 %
65 %
29 %
5 %
59 %
57 %
4 %
28 %
Spring
53 %
16 %
29 %
20 %
20 %
60 %
55 %
12 %
33 %
61 %
16 %
16 %
Summer
52 %
9 %
31 %
45 %
3 %
35 %
53 %
8 %
33 %
56 %
16 %
26 %
Autumn
49 %
0 %
42 %
47 %
0 %
53 %
53 %
0 %
16 %
All year
47 %
7 %
40 %
33 %
3 %
51 %
45 %
6 %
44 %
58 %
11 %
25 %
Fig. 10.10 Scatter diagram of atomic nutrient ratios for the water column of station S7 for the period 1987–2010. DIN, P and Si represent
dissolved inorganic nitrogen (NO 3
− + NO 2
− + NH 4
+ ), P, and Si. Stoichiometric (=potential) limitation for DIN, P, and Si is indicated by the
number of data points in the various quadrants