

10 Seasonal and Spatial Nutrient Dynamics in Saronikos Gulf: The Impact of Sewage Effluents …
121
ation at station S7 during 1995–2010 with two main peaks
in summer (June–August), late autumn (November) and
March (Fig. 10.9). Minimum concentrations of nitrate and
nitrite in spring related to the biological activity. The spring
enhances chlorophyll values and consumption of nitrates by
phytoplankton for biomass formation, whereas minimum
was recorded during September–October. Similarly, in Elefsis Bay (north of Saronikos Gulf), SRP, silicate, DIN, and
ammonium concentrations at the near-bottom waters were
usually maximal in September, but elevated concentrations
were found during July to November and minimum in April
(Pavlidou et al. 2010).
Concerning the different forms of dissolved inorganic nitrogen (DIN), all forms (ΝΟ 3
− , ΝΟ 2
− and ΝΗ 4
+ ) were present, but after 1996 a significant increase of the NH 4
+ /DIN
(%) from 38 to almost 80 was observed in the layer from 30
to 60 m during the warm period, with a parallel decrease of
NO 3
− /DIN (%) from 44 to 17.
The mean Si:DIN ratio did not show significant seasonal variation (average value for the period 1987–2010:
1.16 ± 0.23; for the period 1987–1994: 0.93 ± 0.22; for the
period 1995–2010: 1.23 ± 0.30). A higher Si:NO 3
- value was
recorded in September (average value for the period 1995–
2010: 5.20). On the other hand, the Si:P mean ratio showed
significant seasonal variation with high values in April and
May (11.4 and 13, respectively, for the period 1987–2010
and 13 and 14.1 for the period 1995–2010) and low mean
values (5.8 for the period 1987–1994 and 5.6 for the period
1995–2010) in March. The Si:P ratio calculated for the period 1987–1994 exhibited high values in November (15.9)
that decreased significantly in January (4.64). Our results
showed that silicate concentrations in the water column of
station S7 for the period 1995–2010 has increased compared
with the 1987–1994 period.
The atomic Si:N:P ratio of marine diatoms is about
16:16:1 in a nutrient-replete ecosystem (Redfield 1958;
Brzezinski 1985; Xu et al. 2008). Deviation from the Redfield ratio indicates the potential for N, P, or Si limitation
of phytoplankton growth. In our assessment of stoichiometric limitations, we have calculated Redfield ratiosfollowing
Pavlidou et al. (2004) and Xu et al. (2008) to predict:
1. N limitation occurs when DIN:SRP < 16 and DIN:Si < 1
2. P limitation occurs when DIN:SRP > 16 and Si:SRP > 16
3. Si limitation occurs when DIN:Si > 1 and Si:SRP < 16
Plots of the atomic Si:SRP against DIN:SRP ratios in the
water column of station S7 indicate that the nutrients are potentially limiting the phytoplankton biomass. The data points
in the upper left quadrant (DIN:SRP < 16:1) are indicative
of N limitation, in the upper right quadrant are indicative
of P limitation, and of Si limitation in the lower left quadrant (Fig. 10.10). The quadrant with the most data points
indicates frequent occurrences of potential limitation of a
particular nutrient. The calculation of the ratios DIN:SRP,
Si:SRP and Si:DIN in the entire water column of station S7
( n = 801) during the period 1987–2010 (both warm and cold
periods included) indicated stoichiometric P-limitation by
about 7 %. Furthermore, the data indicated significant probable N-limitation (47 %), whereas Si-limitation was 40 %.
During summer (June-September) N-limitation calculated
to be 52 %, whereas P-limitation and Si-limitation was 9 %
and 31 %, respectively. In winter (December–March) P-limitation was not probable (4 %), whereas a shift to Si-limitation (56 %) was observed, while N-limitation in winter was
33 %. It seems that Si concentrations in the water column
of station S7 might affect the dynamics of phytoplankton.
Additionally, in spring (April–May) N-limitation was 53 %,
whereas P-limitation and Si-limitation calculated at 16 %
and 30 % respectively. In November, N-limitation was 49 %,
whereas Si-limitation was 42 % and P-limitation was not
found (Table 10.3). According to the calculations, a general
shift from Si-limitation to N-limitation before and after the
operation of the sewage treatment plant observed at station
S7. Before the sewage treatment, Si-limitation of 60–65 % in
winter and spring seemed to determine the trophic status of
station S7, whereas after the operation of the secondary sewage treatment, significant probable N-limitation recorded.
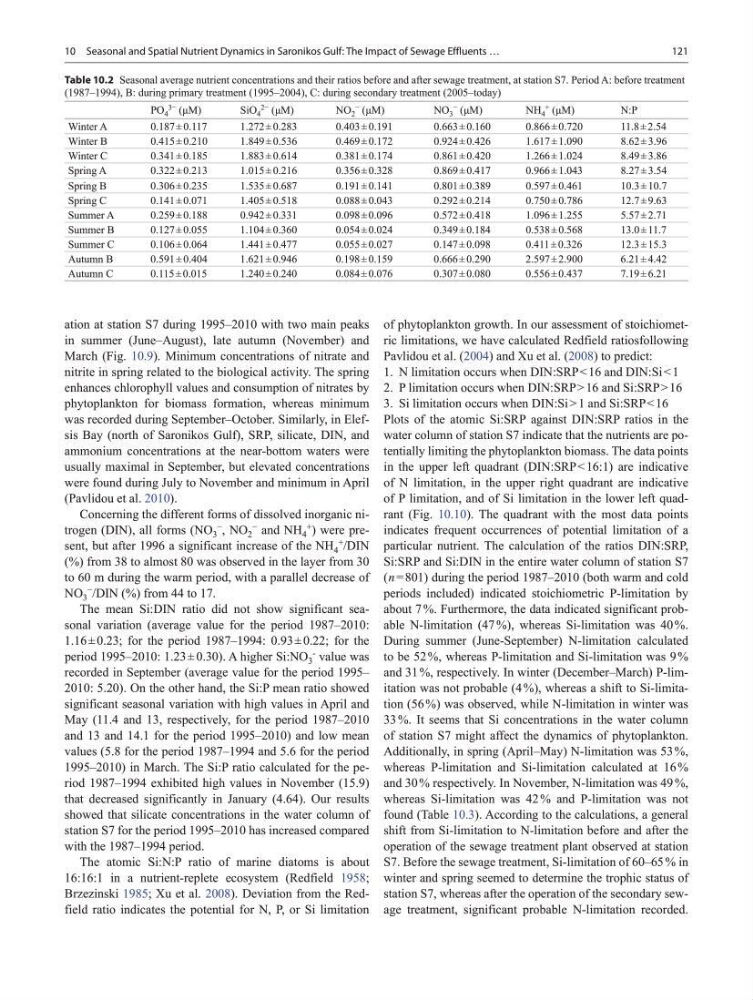
Table 10.2 Seasonal average nutrient concentrations and their ratios before and after sewage treatment, at station S7. Period A: before treatment
(1987–1994), B: during primary treatment (1995–2004), C: during secondary treatment (2005–today)
PO 4
3− (μM)
SiO 4
2− (μM)
NO 2
− (μM)
NO 3
− (μM)
NH 4
+ (μM)
N:P
Winter A
0.187 ± 0.117
1.272 ± 0.283
0.403 ± 0.191
0.663 ± 0.160
0.866 ± 0.720
11.8 ± 2.54
Winter B
0.415 ± 0.210
1.849 ± 0.536
0.469 ± 0.172
0.924 ± 0.426
1.617 ± 1.090
8.62 ± 3.96
Winter C
0.341 ± 0.185
1.883 ± 0.614
0.381 ± 0.174
0.861 ± 0.420
1.266 ± 1.024
8.49 ± 3.86
Spring A
0.322 ± 0.213
1.015 ± 0.216
0.356 ± 0.328
0.869 ± 0.417
0.966 ± 1.043
8.27 ± 3.54
Spring B
0.306 ± 0.235
1.535 ± 0.687
0.191 ± 0.141
0.801 ± 0.389
0.597 ± 0.461
10.3 ± 10.7
Spring C
0.141 ± 0.071
1.405 ± 0.518
0.088 ± 0.043
0.292 ± 0.214
0.750 ± 0.786
12.7 ± 9.63
Summer A
0.259 ± 0.188
0.942 ± 0.331
0.098 ± 0.096
0.572 ± 0.418
1.096 ± 1.255
5.57 ± 2.71
Summer B
0.127 ± 0.055
1.104 ± 0.360
0.054 ± 0.024
0.349 ± 0.184
0.538 ± 0.568
13.0 ± 11.7
Summer C
0.106 ± 0.064
1.441 ± 0.477
0.055 ± 0.027
0.147 ± 0.098
0.411 ± 0.326
12.3 ± 15.3
Autumn B
0.591 ± 0.404
1.621 ± 0.946
0.198 ± 0.159
0.666 ± 0.290
2.597 ± 2.900
6.21 ± 4.42
Autumn C
0.115 ± 0.015
1.240 ± 0.240
0.084 ± 0.076
0.307 ± 0.080
0.556 ± 0.437
7.19 ± 6.21
121
ation at station S7 during 1995–2010 with two main peaks
in summer (June–August), late autumn (November) and
March (Fig. 10.9). Minimum concentrations of nitrate and
nitrite in spring related to the biological activity. The spring
enhances chlorophyll values and consumption of nitrates by
phytoplankton for biomass formation, whereas minimum
was recorded during September–October. Similarly, in Elefsis Bay (north of Saronikos Gulf), SRP, silicate, DIN, and
ammonium concentrations at the near-bottom waters were
usually maximal in September, but elevated concentrations
were found during July to November and minimum in April
(Pavlidou et al. 2010).
Concerning the different forms of dissolved inorganic nitrogen (DIN), all forms (ΝΟ 3
− , ΝΟ 2
− and ΝΗ 4
+ ) were present, but after 1996 a significant increase of the NH 4
+ /DIN
(%) from 38 to almost 80 was observed in the layer from 30
to 60 m during the warm period, with a parallel decrease of
NO 3
− /DIN (%) from 44 to 17.
The mean Si:DIN ratio did not show significant seasonal variation (average value for the period 1987–2010:
1.16 ± 0.23; for the period 1987–1994: 0.93 ± 0.22; for the
period 1995–2010: 1.23 ± 0.30). A higher Si:NO 3
- value was
recorded in September (average value for the period 1995–
2010: 5.20). On the other hand, the Si:P mean ratio showed
significant seasonal variation with high values in April and
May (11.4 and 13, respectively, for the period 1987–2010
and 13 and 14.1 for the period 1995–2010) and low mean
values (5.8 for the period 1987–1994 and 5.6 for the period
1995–2010) in March. The Si:P ratio calculated for the period 1987–1994 exhibited high values in November (15.9)
that decreased significantly in January (4.64). Our results
showed that silicate concentrations in the water column of
station S7 for the period 1995–2010 has increased compared
with the 1987–1994 period.
The atomic Si:N:P ratio of marine diatoms is about
16:16:1 in a nutrient-replete ecosystem (Redfield 1958;
Brzezinski 1985; Xu et al. 2008). Deviation from the Redfield ratio indicates the potential for N, P, or Si limitation
of phytoplankton growth. In our assessment of stoichiometric limitations, we have calculated Redfield ratiosfollowing
Pavlidou et al. (2004) and Xu et al. (2008) to predict:
1. N limitation occurs when DIN:SRP < 16 and DIN:Si < 1
2. P limitation occurs when DIN:SRP > 16 and Si:SRP > 16
3. Si limitation occurs when DIN:Si > 1 and Si:SRP < 16
Plots of the atomic Si:SRP against DIN:SRP ratios in the
water column of station S7 indicate that the nutrients are potentially limiting the phytoplankton biomass. The data points
in the upper left quadrant (DIN:SRP < 16:1) are indicative
of N limitation, in the upper right quadrant are indicative
of P limitation, and of Si limitation in the lower left quadrant (Fig. 10.10). The quadrant with the most data points
indicates frequent occurrences of potential limitation of a
particular nutrient. The calculation of the ratios DIN:SRP,
Si:SRP and Si:DIN in the entire water column of station S7
( n = 801) during the period 1987–2010 (both warm and cold
periods included) indicated stoichiometric P-limitation by
about 7 %. Furthermore, the data indicated significant probable N-limitation (47 %), whereas Si-limitation was 40 %.
During summer (June-September) N-limitation calculated
to be 52 %, whereas P-limitation and Si-limitation was 9 %
and 31 %, respectively. In winter (December–March) P-limitation was not probable (4 %), whereas a shift to Si-limitation (56 %) was observed, while N-limitation in winter was
33 %. It seems that Si concentrations in the water column
of station S7 might affect the dynamics of phytoplankton.
Additionally, in spring (April–May) N-limitation was 53 %,
whereas P-limitation and Si-limitation calculated at 16 %
and 30 % respectively. In November, N-limitation was 49 %,
whereas Si-limitation was 42 % and P-limitation was not
found (Table 10.3). According to the calculations, a general
shift from Si-limitation to N-limitation before and after the
operation of the sewage treatment plant observed at station
S7. Before the sewage treatment, Si-limitation of 60–65 % in
winter and spring seemed to determine the trophic status of
station S7, whereas after the operation of the secondary sewage treatment, significant probable N-limitation recorded.
Table 10.2 Seasonal average nutrient concentrations and their ratios before and after sewage treatment, at station S7. Period A: before treatment
(1987–1994), B: during primary treatment (1995–2004), C: during secondary treatment (2005–today)
PO 4
3− (μM)
SiO 4
2− (μM)
NO 2
− (μM)
NO 3
− (μM)
NH 4
+ (μM)
N:P
Winter A
0.187 ± 0.117
1.272 ± 0.283
0.403 ± 0.191
0.663 ± 0.160
0.866 ± 0.720
11.8 ± 2.54
Winter B
0.415 ± 0.210
1.849 ± 0.536
0.469 ± 0.172
0.924 ± 0.426
1.617 ± 1.090
8.62 ± 3.96
Winter C
0.341 ± 0.185
1.883 ± 0.614
0.381 ± 0.174
0.861 ± 0.420
1.266 ± 1.024
8.49 ± 3.86
Spring A
0.322 ± 0.213
1.015 ± 0.216
0.356 ± 0.328
0.869 ± 0.417
0.966 ± 1.043
8.27 ± 3.54
Spring B
0.306 ± 0.235
1.535 ± 0.687
0.191 ± 0.141
0.801 ± 0.389
0.597 ± 0.461
10.3 ± 10.7
Spring C
0.141 ± 0.071
1.405 ± 0.518
0.088 ± 0.043
0.292 ± 0.214
0.750 ± 0.786
12.7 ± 9.63
Summer A
0.259 ± 0.188
0.942 ± 0.331
0.098 ± 0.096
0.572 ± 0.418
1.096 ± 1.255
5.57 ± 2.71
Summer B
0.127 ± 0.055
1.104 ± 0.360
0.054 ± 0.024
0.349 ± 0.184
0.538 ± 0.568
13.0 ± 11.7
Summer C
0.106 ± 0.064
1.441 ± 0.477
0.055 ± 0.027
0.147 ± 0.098
0.411 ± 0.326
12.3 ± 15.3
Autumn B
0.591 ± 0.404
1.621 ± 0.946
0.198 ± 0.159
0.666 ± 0.290
2.597 ± 2.900
6.21 ± 4.42
Autumn C
0.115 ± 0.015
1.240 ± 0.240
0.084 ± 0.076
0.307 ± 0.080
0.556 ± 0.437
7.19 ± 6.21