

A. Pavlidou et al.
120
trations remained constant (average values: 1.39 ± 0.819 μM
and 1.30 ± 1.284 μM, respectively). The shift of the surface
layer from N-limitation to P-limitation indicates a change in
the trophic status of station S7. Seasonal variability of nutrient limitation is discussed below.
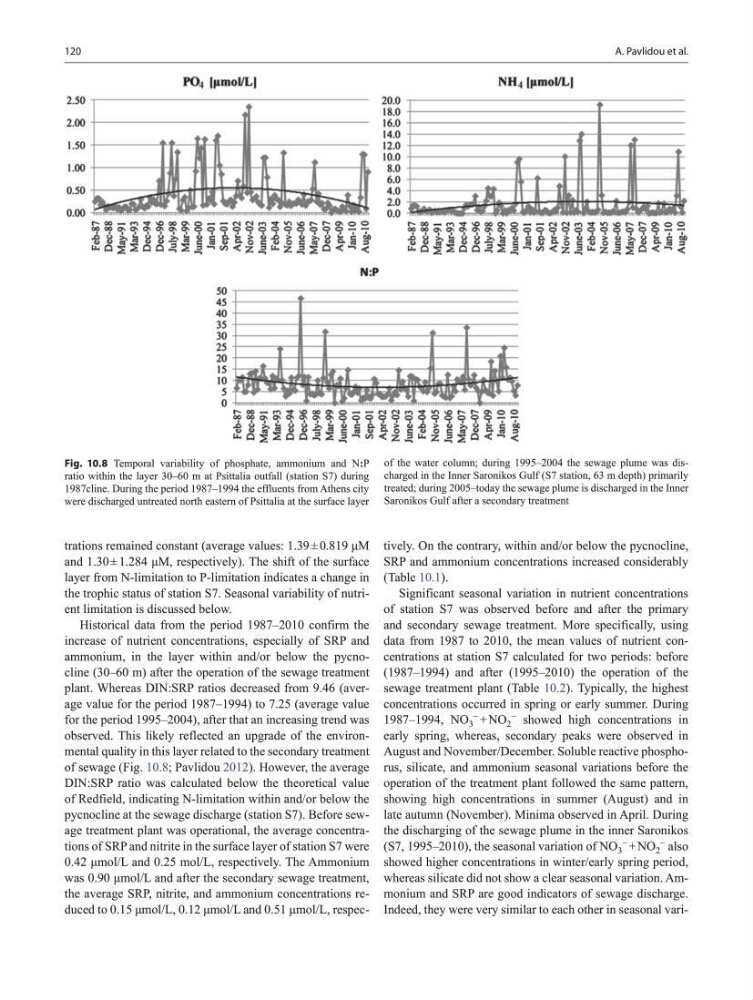
Historical data from the period 1987–2010 confirm the
increase of nutrient concentrations, especially of SRP and
ammonium, in the layer within and/or below the pycnocline (30–60 m) after the operation of the sewage treatment
plant. Whereas DIN:SRP ratios decreased from 9.46 (average value for the period 1987–1994) to 7.25 (average value
for the period 1995–2004), after that an increasing trend was
observed. This likely reflected an upgrade of the environmental quality in this layer related to the secondary treatment
of sewage (Fig. 10.8; Pavlidou 2012). However, the average
DIN:SRP ratio was calculated below the theoretical value
of Redfield, indicating N-limitation within and/or below the
pycnocline at the sewage discharge (station S7). Before sewage treatment plant was operational, the average concentrations of SRP and nitrite in the surface layer of station S7 were
0.42 μmol/L and 0.25 mol/L, respectively. The Ammonium
was 0.90 μmol/L and after the secondary sewage treatment,
the average SRP, nitrite, and ammonium concentrations reduced to 0.15 μmol/L, 0.12 μmol/L and 0.51 μmol/L, respectively. On the contrary, within and/or below the pycnocline,
SRP and ammonium concentrations increased considerably
(Table 10.1).
Significant seasonal variation in nutrient concentrations
of station S7 was observed before and after the primary
and secondary sewage treatment. More specifically, using
data from 1987 to 2010, the mean values of nutrient concentrations at station S7 calculated for two periods: before
(1987–1994) and after (1995–2010) the operation of the
sewage treatment plant (Table 10.2). Typically, the highest
concentrations occurred in spring or early summer. During
1987–1994, NO 3
− + NO 2
− showed high concentrations in
early spring, whereas, secondary peaks were observed in
August and November/December. Soluble reactive phosphorus, silicate, and ammonium seasonal variations before the
operation of the treatment plant followed the same pattern,
showing high concentrations in summer (August) and in
late autumn (November). Minima observed in April. During
the discharging of the sewage plume in the inner Saronikos
(S7, 1995–2010), the seasonal variation of NO 3
− + NO 2
− also
showed higher concentrations in winter/early spring period,
whereas silicate did not show a clear seasonal variation. Ammonium and SRP are good indicators of sewage discharge.
Indeed, they were very similar to each other in seasonal variFig. 10.8 Temporal variability of phosphate, ammonium and N:P
ratio within the layer 30–60 m at Psittalia outfall (station S7) during
1987cline. During the period 1987–1994 the effluents from Athens city
were discharged untreated north eastern of Psittalia at the surface layer
of the water column; during 1995–2004 the sewage plume was discharged in the Inner Saronikos Gulf (S7 station, 63 m depth) primarily
treated; during 2005–today the sewage plume is discharged in the Inner
Saronikos Gulf after a secondary treatment
120
trations remained constant (average values: 1.39 ± 0.819 μM
and 1.30 ± 1.284 μM, respectively). The shift of the surface
layer from N-limitation to P-limitation indicates a change in
the trophic status of station S7. Seasonal variability of nutrient limitation is discussed below.
Historical data from the period 1987–2010 confirm the
increase of nutrient concentrations, especially of SRP and
ammonium, in the layer within and/or below the pycnocline (30–60 m) after the operation of the sewage treatment
plant. Whereas DIN:SRP ratios decreased from 9.46 (average value for the period 1987–1994) to 7.25 (average value
for the period 1995–2004), after that an increasing trend was
observed. This likely reflected an upgrade of the environmental quality in this layer related to the secondary treatment
of sewage (Fig. 10.8; Pavlidou 2012). However, the average
DIN:SRP ratio was calculated below the theoretical value
of Redfield, indicating N-limitation within and/or below the
pycnocline at the sewage discharge (station S7). Before sewage treatment plant was operational, the average concentrations of SRP and nitrite in the surface layer of station S7 were
0.42 μmol/L and 0.25 mol/L, respectively. The Ammonium
was 0.90 μmol/L and after the secondary sewage treatment,
the average SRP, nitrite, and ammonium concentrations reduced to 0.15 μmol/L, 0.12 μmol/L and 0.51 μmol/L, respectively. On the contrary, within and/or below the pycnocline,
SRP and ammonium concentrations increased considerably
(Table 10.1).
Significant seasonal variation in nutrient concentrations
of station S7 was observed before and after the primary
and secondary sewage treatment. More specifically, using
data from 1987 to 2010, the mean values of nutrient concentrations at station S7 calculated for two periods: before
(1987–1994) and after (1995–2010) the operation of the
sewage treatment plant (Table 10.2). Typically, the highest
concentrations occurred in spring or early summer. During
1987–1994, NO 3
− + NO 2
− showed high concentrations in
early spring, whereas, secondary peaks were observed in
August and November/December. Soluble reactive phosphorus, silicate, and ammonium seasonal variations before the
operation of the treatment plant followed the same pattern,
showing high concentrations in summer (August) and in
late autumn (November). Minima observed in April. During
the discharging of the sewage plume in the inner Saronikos
(S7, 1995–2010), the seasonal variation of NO 3
− + NO 2
− also
showed higher concentrations in winter/early spring period,
whereas silicate did not show a clear seasonal variation. Ammonium and SRP are good indicators of sewage discharge.
Indeed, they were very similar to each other in seasonal variFig. 10.8 Temporal variability of phosphate, ammonium and N:P
ratio within the layer 30–60 m at Psittalia outfall (station S7) during
1987cline. During the period 1987–1994 the effluents from Athens city
were discharged untreated north eastern of Psittalia at the surface layer
of the water column; during 1995–2004 the sewage plume was discharged in the Inner Saronikos Gulf (S7 station, 63 m depth) primarily
treated; during 2005–today the sewage plume is discharged in the Inner
Saronikos Gulf after a secondary treatment