

10 Seasonal and Spatial Nutrient Dynamics in Saronikos Gulf: The Impact of Sewage Effluents …
119
SRP and ammonium concentrations within and below the
pycnocline was observed.
In winter (February/March), nutrient concentrations at
station S7 remained almost stable with depth, with relatively
higher values in the surface layer. Soluble reactive phosphorus and ammonium concentrations in the surface layer
(2–20 m) ranged between 0.09 and 2.33 μM (average value
0.416 ± 0.232 μM) and from 0.50 to 11.2 μM (average value
1.53 ± 1.72 μM), respectively. In the layer from 30 m to the
bottom, SRP and ammonium concentrations were lower
and ranged between 0.09 and 0.929 μM (average value
0.240 ± 0.121 μM) for SRP and from 0.07–2.45 (average
value 0.615 ± 0.539 μM) for ammonium. The DIN:SRP ratio
(DIN stands for the sum of nitrate + nitrite + ammonium)
was 7.53 in the surface layer and 8.59 in the layer from 30 m
to the bottom.
During the warm August/September of 1987–1994 SRP
concentrations in the surface layer ranged between 0.040 and
0.890 μΜ (average value 0.241 ± 0.185 μM). Whereas during 1995–2010 SRP concentration was, lower and ranged between 0.012 and 0.173 μM (average value 0.094 ± 0.057 μM).
Similarly, ammonium concentrations ranged between 0.160
and 5.580 μM (average value 0.838 ± 0.682 μM) during the
period 1987–1994, whereas, during 1995–2010 ammonium
concentrations were lower (average value 0.547 ± 0.681 μM).
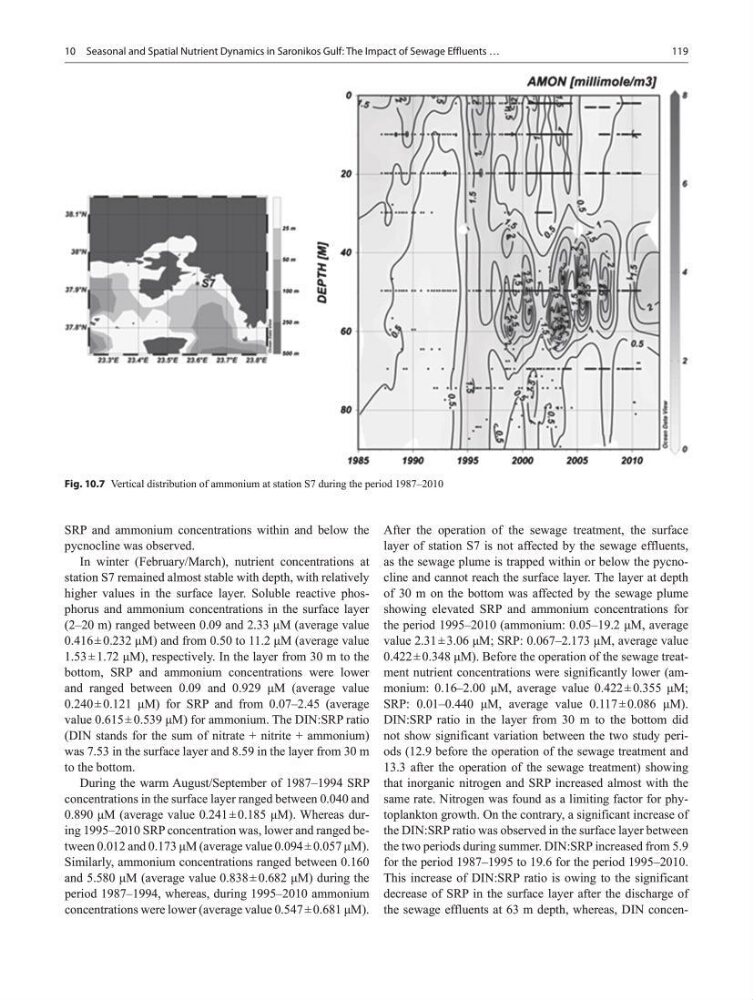
After the operation of the sewage treatment, the surface
layer of station S7 is not affected by the sewage effluents,
as the sewage plume is trapped within or below the pycnocline and cannot reach the surface layer. The layer at depth
of 30 m on the bottom was affected by the sewage plume
showing elevated SRP and ammonium concentrations for
the period 1995–2010 (ammonium: 0.05–19.2 μM, average
value 2.31 ± 3.06 μM; SRP: 0.067–2.173 μM, average value
0.422 ± 0.348 μM). Before the operation of the sewage treatment nutrient concentrations were significantly lower (ammonium: 0.16–2.00 μM, average value 0.422 ± 0.355 μM;
SRP: 0.01–0.440 μM, average value 0.117 ± 0.086 μM).
DIN:SRP ratio in the layer from 30 m to the bottom did
not show significant variation between the two study periods (12.9 before the operation of the sewage treatment and
13.3 after the operation of the sewage treatment) showing
that inorganic nitrogen and SRP increased almost with the
same rate. Nitrogen was found as a limiting factor for phytoplankton growth. On the contrary, a significant increase of
the DIN:SRP ratio was observed in the surface layer between
the two periods during summer. DIN:SRP increased from 5.9
for the period 1987–1995 to 19.6 for the period 1995–2010.
This increase of DIN:SRP ratio is owing to the significant
decrease of SRP in the surface layer after the discharge of
the sewage effluents at 63 m depth, whereas, DIN concenFig. 10.7 Vertical distribution of ammonium at station S7 during the period 1987–2010
119
SRP and ammonium concentrations within and below the
pycnocline was observed.
In winter (February/March), nutrient concentrations at
station S7 remained almost stable with depth, with relatively
higher values in the surface layer. Soluble reactive phosphorus and ammonium concentrations in the surface layer
(2–20 m) ranged between 0.09 and 2.33 μM (average value
0.416 ± 0.232 μM) and from 0.50 to 11.2 μM (average value
1.53 ± 1.72 μM), respectively. In the layer from 30 m to the
bottom, SRP and ammonium concentrations were lower
and ranged between 0.09 and 0.929 μM (average value
0.240 ± 0.121 μM) for SRP and from 0.07–2.45 (average
value 0.615 ± 0.539 μM) for ammonium. The DIN:SRP ratio
(DIN stands for the sum of nitrate + nitrite + ammonium)
was 7.53 in the surface layer and 8.59 in the layer from 30 m
to the bottom.
During the warm August/September of 1987–1994 SRP
concentrations in the surface layer ranged between 0.040 and
0.890 μΜ (average value 0.241 ± 0.185 μM). Whereas during 1995–2010 SRP concentration was, lower and ranged between 0.012 and 0.173 μM (average value 0.094 ± 0.057 μM).
Similarly, ammonium concentrations ranged between 0.160
and 5.580 μM (average value 0.838 ± 0.682 μM) during the
period 1987–1994, whereas, during 1995–2010 ammonium
concentrations were lower (average value 0.547 ± 0.681 μM).
After the operation of the sewage treatment, the surface
layer of station S7 is not affected by the sewage effluents,
as the sewage plume is trapped within or below the pycnocline and cannot reach the surface layer. The layer at depth
of 30 m on the bottom was affected by the sewage plume
showing elevated SRP and ammonium concentrations for
the period 1995–2010 (ammonium: 0.05–19.2 μM, average
value 2.31 ± 3.06 μM; SRP: 0.067–2.173 μM, average value
0.422 ± 0.348 μM). Before the operation of the sewage treatment nutrient concentrations were significantly lower (ammonium: 0.16–2.00 μM, average value 0.422 ± 0.355 μM;
SRP: 0.01–0.440 μM, average value 0.117 ± 0.086 μM).
DIN:SRP ratio in the layer from 30 m to the bottom did
not show significant variation between the two study periods (12.9 before the operation of the sewage treatment and
13.3 after the operation of the sewage treatment) showing
that inorganic nitrogen and SRP increased almost with the
same rate. Nitrogen was found as a limiting factor for phytoplankton growth. On the contrary, a significant increase of
the DIN:SRP ratio was observed in the surface layer between
the two periods during summer. DIN:SRP increased from 5.9
for the period 1987–1995 to 19.6 for the period 1995–2010.
This increase of DIN:SRP ratio is owing to the significant
decrease of SRP in the surface layer after the discharge of
the sewage effluents at 63 m depth, whereas, DIN concenFig. 10.7 Vertical distribution of ammonium at station S7 during the period 1987–2010