

104
M. T. Dokulil
optimum depth to daily column carbon production (Klapper
1992, p. 79)
(9.2)
Oligotrophic Mesotrophic Eutrophic Polytrophic Hypertrophic
≤ 15
15–30
30–75
75–90
> 90
A graphical approach modified from Vollenweider (1968)
provides an elegant summary of the volumetric versus integrated rate controversy (Fig. 9.6).
A range of maximum and mean attenuation coefficients
supply additional information on light availability, water
transparency and indirectly on lake depth. As optimum
carbon uptake rates at varying attenuation coefficients increase, column production tends to decline because of reduced light availability (higher attenuation coefficients) as
a consequence of self-shading by enhanced algal biomass.
Figure 9.6 also illustrates the potential variability of carbon uptake rates within a broad range of possible attenuation coefficients representing clear to turbid conditions.
The potential range, however, is strongly reduced at high
A opt
P
mgCm
−3 d
−1
mgCm −2 d −1 (%)
trophic level. Some examples of individual lakes or geographical regions are inserted to demonstrate the range of
carbon uptakes commonly encountered. Some examples
from European alpine lakes can be found in Dokulil (2005;
Fig. 9.6). Eutrophic lakes in warm regions of the world
such as Egypt, East Africa and China are good examples of
highly productive waters. The theoretical maximum rate,
which has been derived from theoretical considerations by
Vollenweider (1965a), can be described by an exponential
equation
(9.3)
Based on earlier arguments and formulations, Bannister
(1974) developed an equation for the upper limit of production, which is identical to the one given by Vollenweider
(1968, p. 43).
(9.4)
with f i = 2.5 (2 – 3.5)—Vollenweider (1968), f i = 2.3—Bannister (1974) and k w attenuation coefficient.
ΣP = 2952.563 × (1 − exp(−0.014A opt )) + 2595.813
× (1−exp(−0.00094A opt )), r
2
= 0.99, p < 0.0001
ΣP [g Cm −2 d
−1
] = f i × A opt /k w
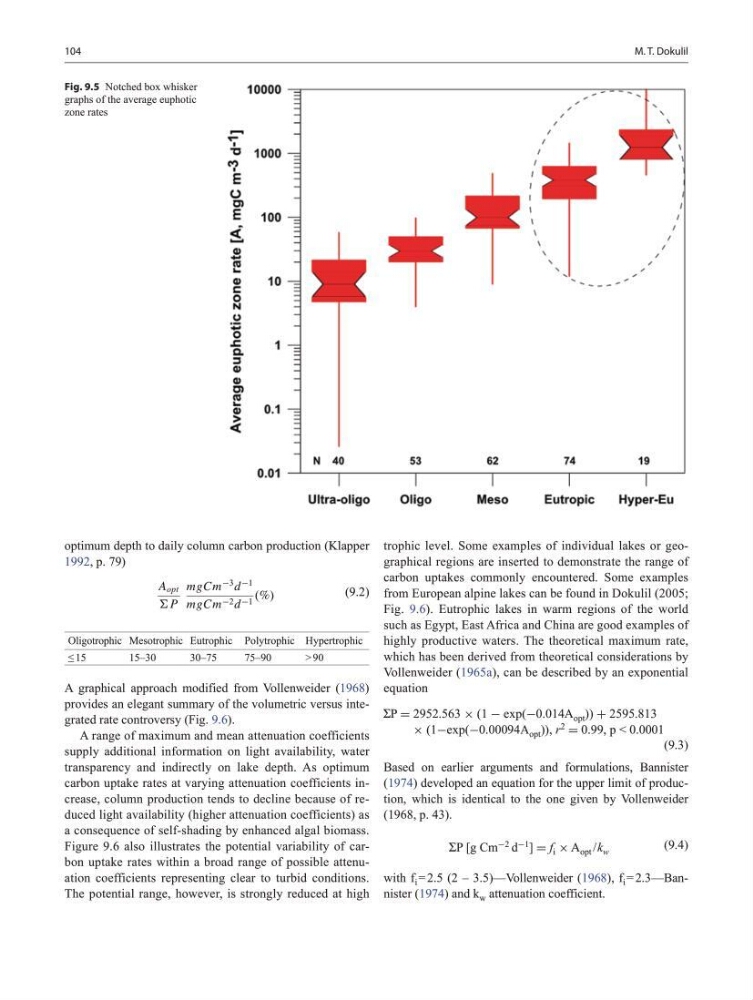
Fig. 9.5 Notched box whisker
graphs of the average euphotic
zone rates
M. T. Dokulil
optimum depth to daily column carbon production (Klapper
1992, p. 79)
(9.2)
Oligotrophic Mesotrophic Eutrophic Polytrophic Hypertrophic
≤ 15
15–30
30–75
75–90
> 90
A graphical approach modified from Vollenweider (1968)
provides an elegant summary of the volumetric versus integrated rate controversy (Fig. 9.6).
A range of maximum and mean attenuation coefficients
supply additional information on light availability, water
transparency and indirectly on lake depth. As optimum
carbon uptake rates at varying attenuation coefficients increase, column production tends to decline because of reduced light availability (higher attenuation coefficients) as
a consequence of self-shading by enhanced algal biomass.
Figure 9.6 also illustrates the potential variability of carbon uptake rates within a broad range of possible attenuation coefficients representing clear to turbid conditions.
The potential range, however, is strongly reduced at high
A opt
P
mgCm
−3 d
−1
mgCm −2 d −1 (%)
trophic level. Some examples of individual lakes or geographical regions are inserted to demonstrate the range of
carbon uptakes commonly encountered. Some examples
from European alpine lakes can be found in Dokulil (2005;
Fig. 9.6). Eutrophic lakes in warm regions of the world
such as Egypt, East Africa and China are good examples of
highly productive waters. The theoretical maximum rate,
which has been derived from theoretical considerations by
Vollenweider (1965a), can be described by an exponential
equation
(9.3)
Based on earlier arguments and formulations, Bannister
(1974) developed an equation for the upper limit of production, which is identical to the one given by Vollenweider
(1968, p. 43).
(9.4)
with f i = 2.5 (2 – 3.5)—Vollenweider (1968), f i = 2.3—Bannister (1974) and k w attenuation coefficient.
ΣP = 2952.563 × (1 − exp(−0.014A opt )) + 2595.813
× (1−exp(−0.00094A opt )), r
2
= 0.99, p < 0.0001
ΣP [g Cm −2 d
−1
] = f i × A opt /k w
Fig. 9.5 Notched box whisker
graphs of the average euphotic
zone rates