

103
9 Photoautotrophic Productivity in Eutrophic Ecosystems
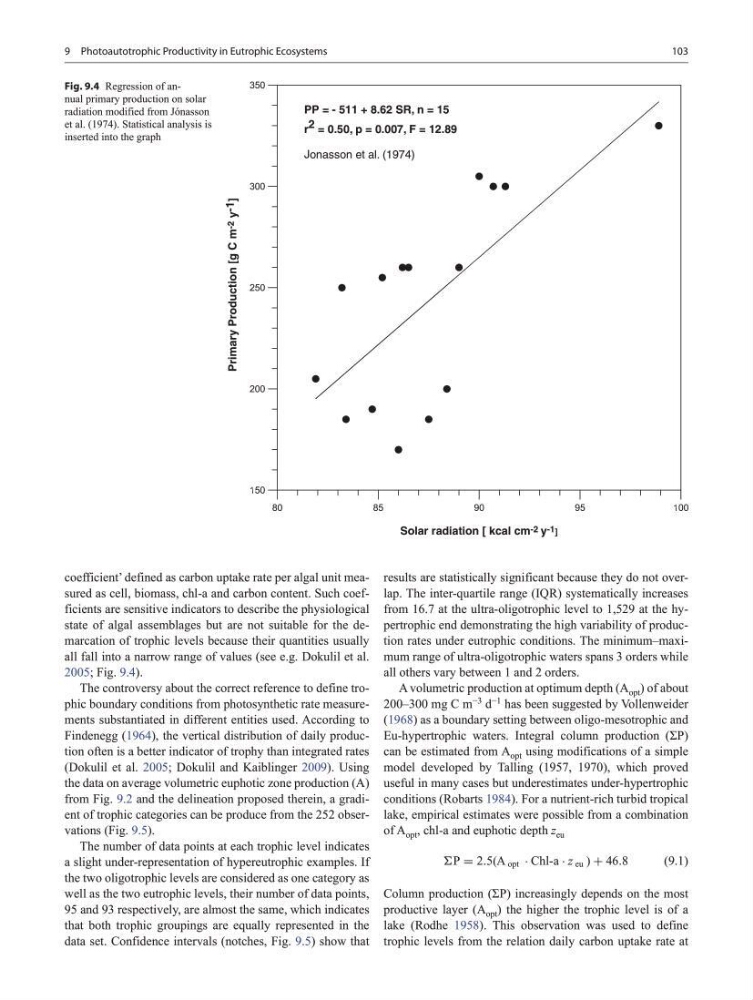
coefficient’ defined as carbon uptake rate per algal unit measured as cell, biomass, chl-a and carbon content. Such coefficients are sensitive indicators to describe the physiological
state of algal assemblages but are not suitable for the demarcation of trophic levels because their quantities usually
all fall into a narrow range of values (see e.g. Dokulil et al.
2005; Fig. 9.4).
The controversy about the correct reference to define trophic boundary conditions from photosynthetic rate measurements substantiated in different entities used. According to
Findenegg (1964), the vertical distribution of daily production often is a better indicator of trophy than integrated rates
(Dokulil et al. 2005; Dokulil and Kaiblinger 2009). Using
the data on average volumetric euphotic zone production (A)
from Fig. 9.2 and the delineation proposed therein, a gradient of trophic categories can be produce from the 252 observations (Fig. 9.5).
The number of data points at each trophic level indicates
a slight under-representation of hypereutrophic examples. If
the two oligotrophic levels are considered as one category as
well as the two eutrophic levels, their number of data points,
95 and 93 respectively, are almost the same, which indicates
that both trophic groupings are equally represented in the
data set. Confidence intervals (notches, Fig. 9.5) show that
results are statistically significant because they do not overlap. The inter-quartile range (IQR) systematically increases
from 16.7 at the ultra-oligotrophic level to 1,529 at the hypertrophic end demonstrating the high variability of production rates under eutrophic conditions. The minimum–maximum range of ultra-oligotrophic waters spans 3 orders while
all others vary between 1 and 2 orders.
A volumetric production at optimum depth (A opt ) of about
200–300 mg C m
−3
d
−1
has been suggested by Vollenweider
(1968) as a boundary setting between oligo-mesotrophic and
Eu-hypertrophic waters. Integral column production (ΣP)
can be estimated from A opt using modifications of a simple
model developed by Talling (1957, 1970), which proved
useful in many cases but underestimates under-hypertrophic
conditions (Robarts 1984). For a nutrient-rich turbid tropical
lake, empirical estimates were possible from a combination
of A opt , chl-a and euphotic depth z eu
(9.1)
Column production (ΣP) increasingly depends on the most
productive layer (A opt ) the higher the trophic level is of a
lake (Rodhe 1958). This observation was used to define
trophic levels from the relation daily carbon uptake rate at
P = 2.5(A opt · Chl-a · z eu ) + 46.8
Solar radiation [ kcal cm -2 y -1 ]
PP = - 511 + 8.62 SR, n = 15
Jonasson et al. (1974)
r 2 = 0.50, p = 0.007, F = 12.89
Primary Production [g C m -2
y -1
]
Fig. 9.4 Regression of annual primary production on solar
radiation modified from Jónasson
et al. (1974). Statistical analysis is
inserted into the graph
9 Photoautotrophic Productivity in Eutrophic Ecosystems
coefficient’ defined as carbon uptake rate per algal unit measured as cell, biomass, chl-a and carbon content. Such coefficients are sensitive indicators to describe the physiological
state of algal assemblages but are not suitable for the demarcation of trophic levels because their quantities usually
all fall into a narrow range of values (see e.g. Dokulil et al.
2005; Fig. 9.4).
The controversy about the correct reference to define trophic boundary conditions from photosynthetic rate measurements substantiated in different entities used. According to
Findenegg (1964), the vertical distribution of daily production often is a better indicator of trophy than integrated rates
(Dokulil et al. 2005; Dokulil and Kaiblinger 2009). Using
the data on average volumetric euphotic zone production (A)
from Fig. 9.2 and the delineation proposed therein, a gradient of trophic categories can be produce from the 252 observations (Fig. 9.5).
The number of data points at each trophic level indicates
a slight under-representation of hypereutrophic examples. If
the two oligotrophic levels are considered as one category as
well as the two eutrophic levels, their number of data points,
95 and 93 respectively, are almost the same, which indicates
that both trophic groupings are equally represented in the
data set. Confidence intervals (notches, Fig. 9.5) show that
results are statistically significant because they do not overlap. The inter-quartile range (IQR) systematically increases
from 16.7 at the ultra-oligotrophic level to 1,529 at the hypertrophic end demonstrating the high variability of production rates under eutrophic conditions. The minimum–maximum range of ultra-oligotrophic waters spans 3 orders while
all others vary between 1 and 2 orders.
A volumetric production at optimum depth (A opt ) of about
200–300 mg C m
−3
d
−1
has been suggested by Vollenweider
(1968) as a boundary setting between oligo-mesotrophic and
Eu-hypertrophic waters. Integral column production (ΣP)
can be estimated from A opt using modifications of a simple
model developed by Talling (1957, 1970), which proved
useful in many cases but underestimates under-hypertrophic
conditions (Robarts 1984). For a nutrient-rich turbid tropical
lake, empirical estimates were possible from a combination
of A opt , chl-a and euphotic depth z eu
(9.1)
Column production (ΣP) increasingly depends on the most
productive layer (A opt ) the higher the trophic level is of a
lake (Rodhe 1958). This observation was used to define
trophic levels from the relation daily carbon uptake rate at
P = 2.5(A opt · Chl-a · z eu ) + 46.8
Solar radiation [ kcal cm -2 y -1 ]
PP = - 511 + 8.62 SR, n = 15
Jonasson et al. (1974)
r 2 = 0.50, p = 0.007, F = 12.89
Primary Production [g C m -2
y -1
]
Fig. 9.4 Regression of annual primary production on solar
radiation modified from Jónasson
et al. (1974). Statistical analysis is
inserted into the graph