

369
throughput. This has been implemented in the Optical Plankton Analyzer (Dubelaar et al.
1989), and allows sampling rates of up to several ml min-). With this flow system it is
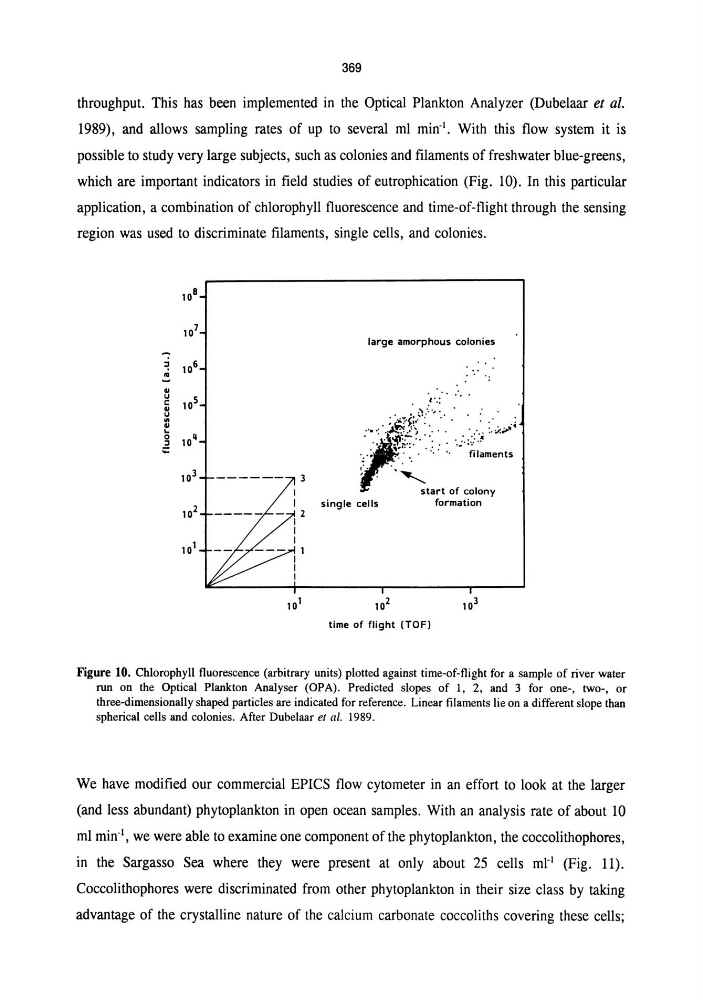
possible to study very large subjects, such as colonies and filaments of freshwater blue-greens,
which are important indicators in field studies of eutrophication (Fig. 10). In this particular
application, a combination of chlorophyll fluorescence and time-of-flight through the sensing
region was used to discriminate filaments, single cells, and colonies.
10 8
10 7
~
=! 10 6
II
GI
u
10 5
c:
GI
U
. .
GI
. .
10 4
0
::s
;:
10 3
10 2
'0'
large amorphous colonies
.' "
- .
. :~.:: .. : ..
. ' .¥ '. i:!:"" '0' • •
•
. ,~~! .. '.
.
. ' . ' •
,.,. :' ::' . ,;.;;:; ,."",
... ;
. .. . .....
filaments
~ .... ,
start of colony
single cells
formation
10 2
time of flight (TOFI
Figure 10. Chlorophyll fluorescence (arbitrary units) plotted against time-of-flight for a sample of river water
run on the Optical Plankton Analyser (OPA). Predicted slopes of 1, 2, and 3 for one-, two-, or
three-dimensionally shaped particles are indicated for reference. Linear filaments lie on a different slope than
spherical cells and colonies. After Dubelaar et al. 1989.
We have modified our commercial EPICS flow cytometer in an effort to look at the larger
(and less abundant) phytoplankton in open ocean samples. With an analysis rate of about 10
ml min-), we were able to examine one component of the phytoplankton, the coccolithophores,
in the Sargasso Sea where they were present at only about 25 cells ml-) (Fig. 11).
Coccolithophores were discriminated from other phytoplankton in their size class by taking
advantage of the crystalline nature of the calcium carbonate coccoliths covering these cells;
throughput. This has been implemented in the Optical Plankton Analyzer (Dubelaar et al.
1989), and allows sampling rates of up to several ml min-). With this flow system it is
possible to study very large subjects, such as colonies and filaments of freshwater blue-greens,
which are important indicators in field studies of eutrophication (Fig. 10). In this particular
application, a combination of chlorophyll fluorescence and time-of-flight through the sensing
region was used to discriminate filaments, single cells, and colonies.
10 8
10 7
~
=! 10 6
II
GI
u
10 5
c:
GI
U
. .
GI
. .
10 4
0
::s
;:
10 3
10 2
'0'
large amorphous colonies
.' "
- .
. :~.:: .. : ..
. ' .¥ '. i:!:"" '0' • •
•
. ,~~! .. '.
.
. ' . ' •
,.,. :' ::' . ,;.;;:; ,."",
... ;
. .. . .....
filaments
~ .... ,
start of colony
single cells
formation
10 2
time of flight (TOFI
Figure 10. Chlorophyll fluorescence (arbitrary units) plotted against time-of-flight for a sample of river water
run on the Optical Plankton Analyser (OPA). Predicted slopes of 1, 2, and 3 for one-, two-, or
three-dimensionally shaped particles are indicated for reference. Linear filaments lie on a different slope than
spherical cells and colonies. After Dubelaar et al. 1989.
We have modified our commercial EPICS flow cytometer in an effort to look at the larger
(and less abundant) phytoplankton in open ocean samples. With an analysis rate of about 10
ml min-), we were able to examine one component of the phytoplankton, the coccolithophores,
in the Sargasso Sea where they were present at only about 25 cells ml-) (Fig. 11).
Coccolithophores were discriminated from other phytoplankton in their size class by taking
advantage of the crystalline nature of the calcium carbonate coccoliths covering these cells;