

368
pers. comm.). When we begin looking at the rarer cells in the nanoplankton and larger classes
in non-bloom situations, however, flow cytometers run into a sampling problem. This was
pointed out by Perry and Porter (1989) in a study of chlorophyll fluorescence as an indicator
of phytoplankton light absorption. They noted that in the Sargasso Sea, a very few large cells
(which were not well represented in the 0.2 ml samples analyzed by their flow cytometer)
3.0
3.0
Cyanobacteria
!...
Cyanobacteria
3
Ql
()
a
2.0
v 2.0
....
.. ()
z
.
<:
..... • .&. v
: -:~:.:;p
()
1.0
V
1.0
<:
. ~
f
0
..
"
&:
0.0
0.0
1
10
100
1000
1
10
100
1000
1.5
1.5
Small Eukaryotes
Small Eukaryotes
~
I
Ql
a
1.0
.
"
1.0
.. \0
v
Z
.... .
()
. , <: v
0.5
O!
.s
v 0.5
Z
~
0
"
&:
0.0
..
0.0
1
10
100
1000
1
10
100
1000
1.5
I..
Large Eukaryote!
I
Large Eukaryotes
~
Ql
()
a
1.0
v 1.0
.
Z
"
... "
<:
v
..
()
0.5
v 0.5
.5
~
Z
0
"
&:
0.0
0.0
1
10
I
10
100
tODD
Light (J.lE m- 2 s-l)
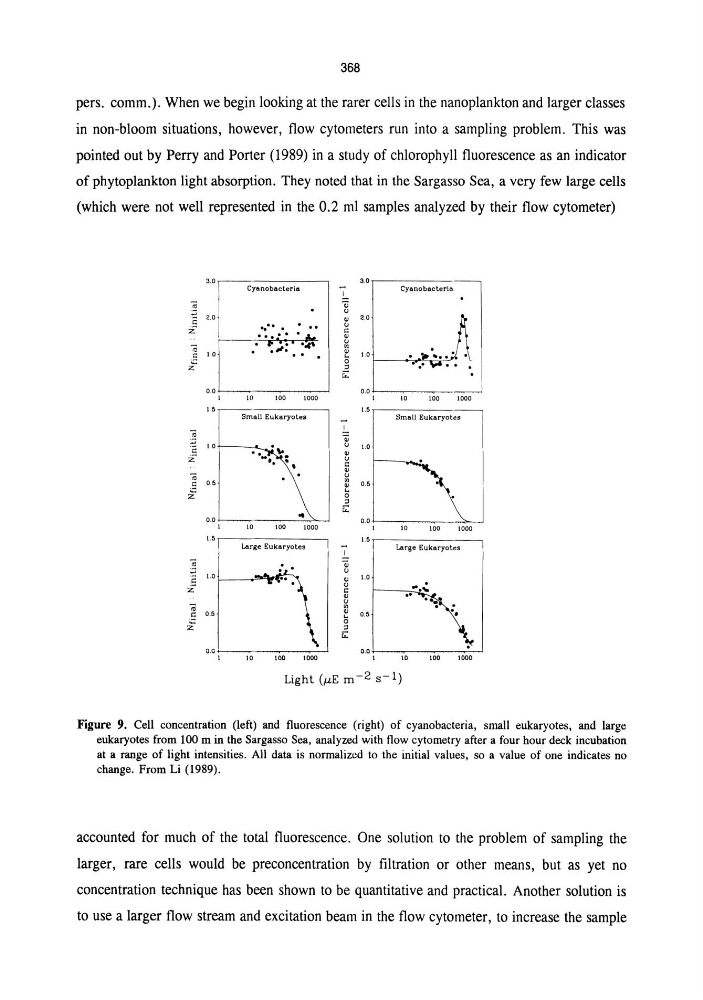
Figure 9. Cell concentration (left) and fluorescence (right) of cyanobacteria, small eukaryotes, and large
eukaryotes from 100 m in the Sargasso Sea, analyzed with flow cytometry after a four hour deck incubation
at a range of light intensities. All data is normalized to the initial values, so a value of one indicates no
change. From Li (1989).
accounted for much of the total fluorescence. One solution to the problem of sampling the
larger, rare cells would be preconcentration by filtration or other means, but as yet no
concentration technique has been shown to be quantitative and practical. Another solution is
to use a larger flow stream and excitation beam in the flow cytometer, to increase the sample
pers. comm.). When we begin looking at the rarer cells in the nanoplankton and larger classes
in non-bloom situations, however, flow cytometers run into a sampling problem. This was
pointed out by Perry and Porter (1989) in a study of chlorophyll fluorescence as an indicator
of phytoplankton light absorption. They noted that in the Sargasso Sea, a very few large cells
(which were not well represented in the 0.2 ml samples analyzed by their flow cytometer)
3.0
3.0
Cyanobacteria
!...
Cyanobacteria
3
Ql
()
a
2.0
v 2.0
....
.. ()
z
.
<:
..... • .&. v
: -:~:.:;p
()
1.0
V
1.0
<:
. ~
f
0
..
"
&:
0.0
0.0
1
10
100
1000
1
10
100
1000
1.5
1.5
Small Eukaryotes
Small Eukaryotes
~
I
Ql
a
1.0
.
"
1.0
.. \0
v
Z
.... .
()
. , <: v
0.5
O!
.s
v 0.5
Z
~
0
"
&:
0.0
..
0.0
1
10
100
1000
1
10
100
1000
1.5
I..
Large Eukaryote!
I
Large Eukaryotes
~
Ql
()
a
1.0
v 1.0
.
Z
"
... "
<:
v
..
()
0.5
v 0.5
.5
~
Z
0
"
&:
0.0
0.0
1
10
I
10
100
tODD
Light (J.lE m- 2 s-l)
Figure 9. Cell concentration (left) and fluorescence (right) of cyanobacteria, small eukaryotes, and large
eukaryotes from 100 m in the Sargasso Sea, analyzed with flow cytometry after a four hour deck incubation
at a range of light intensities. All data is normalized to the initial values, so a value of one indicates no
change. From Li (1989).
accounted for much of the total fluorescence. One solution to the problem of sampling the
larger, rare cells would be preconcentration by filtration or other means, but as yet no
concentration technique has been shown to be quantitative and practical. Another solution is
to use a larger flow stream and excitation beam in the flow cytometer, to increase the sample